T Testing Support Level: Stock Gains 0.59% (September 25, 2026)
On September 25, 2026: price 25.45 USD, trend sideways, RSI 51.1, support 25.10, resistance 26.72. technical analysis of t stock. Testing Support Level — full…

AT&T ended at 25.45 USD, up 0.59% on the day, but the more important signal is that the shares are still sitting below the 20-day average at 25.73. That matters because it shows the stock has not yet reclaimed its short-term trend, even though the longer moving average at 24.69 still sits underneath price and provides a broader cushion. In plain terms: the stock is not in a clean breakout, but neither is it in a breakdown.
Trend & Price Action
The chart shows a market stuck between competing forces. T remains in a sideways trend, with the SMA20 slope at -0.21% over 5 days, which tells us short-term momentum is still slightly leaning down. Yet the fact that price is above the SMA50 at 24.69 means the medium-term structure has not turned weak enough to look like a sustained downtrend.
That split is important. When a stock trades below the short average but above the longer one, it often signals hesitation rather than conviction. Traders are still waiting for the next directional cue. The lack of a new MA-cross reinforces that message: there is no fresh trend signal to lean on, just a market moving within a range.
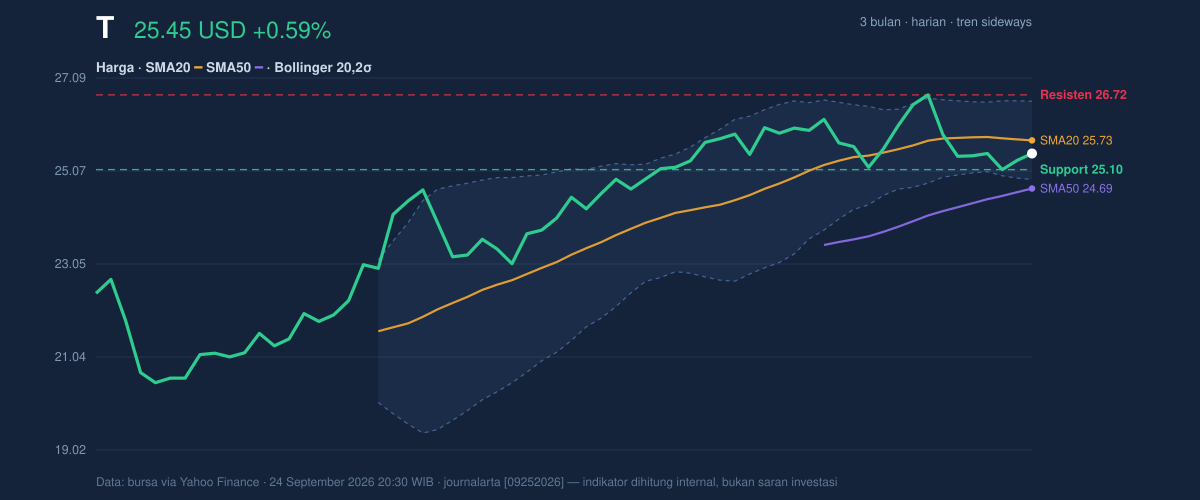
The Bollinger Bands add another layer. Price is near the lower half of the band structure, with %B at 33%, which means the stock is closer to the lower band than the upper band, but not under pressure enough to signal a full downside break. More importantly, the 6.6% band width shows the bands are narrowing. That is a squeeze. In chart terms, a squeeze often means volatility has compressed and the next move can be sharper once price escapes the range. The signal is not direction by itself; it is a warning that the current calm may not last.
Oscillators & Momentum
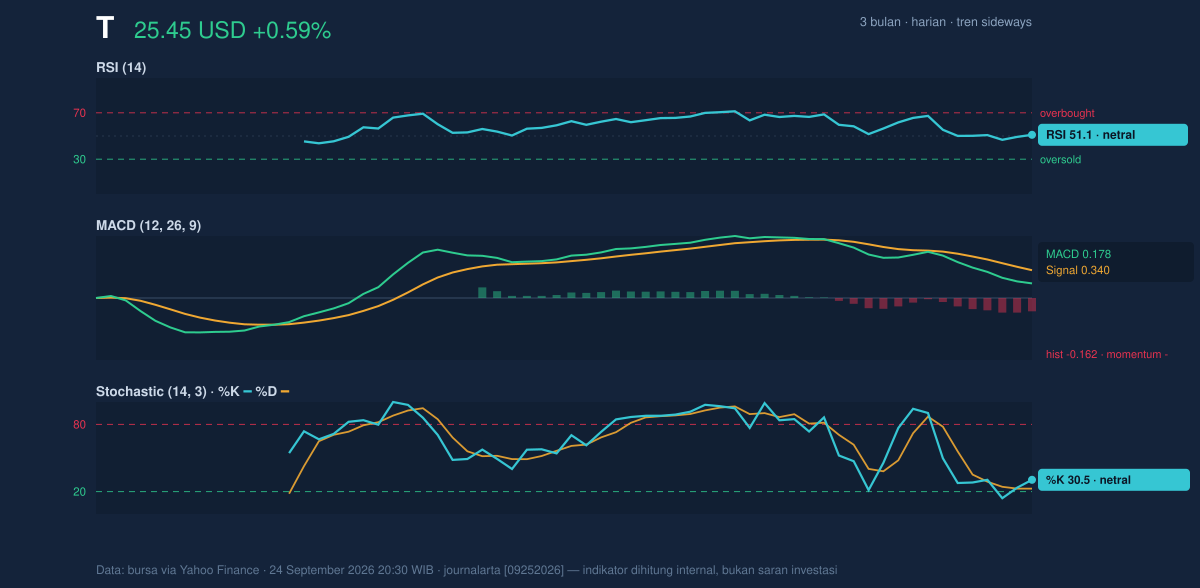
Momentum is mixed, and that is the clearest message in the indicators. RSI at 51.1 is neutral, which means the stock is neither overbought nor oversold. That usually points to balance, not urgency. The Stochastic %K at 30.5 and %D at 22.7 also sit in neutral territory, but with %K above %D, the oscillator is hinting at a mild recovery attempt from a softer level. This is not strong enough to call a reversal, but it does show that selling pressure is not dominating.
The more cautionary signal comes from MACD. MACD at 0.178 is still below the signal line at 0.340, leaving the histogram at -0.162. That negative histogram means recent price action is losing upward momentum relative to the trend signal. In practical terms, the stock may be stabilizing, but it has not yet generated enough force to confirm a sustained push higher. The oscillator set is therefore mixed: RSI and Stochastic are steady, while MACD says momentum is still slightly negative.
Volatility & Volume
Volatility is present, but not extreme. The ATR(14) at 0.65, equal to 2.5% of price, suggests typical daily movement is moderate. That matters because it frames how quickly the stock can move once it leaves the current band. Combined with the narrowing Bollinger structure, this points to a market that may be preparing for a larger move, but has not yet chosen a direction.
Volume adds a useful nuance. Last volume came in at 34,216,400, below the 20-day average of 38,217,145, or about 0.9x normal. That means the latest bounce was not backed by unusually strong participation. A move that happens on lighter turnover can still be real, but it is usually less convincing than one confirmed by strong trading activity.
The one constructive detail is that OBV is rising. On-Balance Volume tracks whether volume is favoring accumulation or distribution, so a rising OBV means buyers have been gradually absorbing shares even if the headline volume number is not impressive. In other words, the market may be quietly building support underneath price, but it has not yet shown enough urgency to force a clear breakout.
Key Levels & Scenarios
The chart marks a tight range. Support at 25.10 is the first level where buyers have recently stepped in, while resistance at 26.72 is the ceiling that has to be cleared before the stock can leave the current range behind. Price is currently sitting at roughly 22% of the range, which places it closer to support than resistance and helps explain why the tone remains cautious rather than bullish.
The broader range matters too. The 3-month high at 26.93 is only slightly above resistance, while the 3-month low at 19.89 is far below current trading. That gap shows the stock has recovered meaningfully from its lower band, but it has not yet re-established a convincing uptrend.
If 25.10 fails, the market would be signaling that the current floor is no longer holding, and the squeeze could resolve lower. If price can reclaim 25.73 and then push through 26.72, the chart would begin to look less like a stalled range and more like an upside attempt with confirmation from a broader band expansion.
Technical Verdict: HOLD (wait & see)
HOLD (wait & see)
- Price is below SMA20 at 25.73, so the short-term trend is still not fully repaired.
- MACD remains below its signal line with a negative histogram, which keeps momentum cautious.
- Bollinger Bands are squeezing, meaning the next decisive move may be coming, but direction is not yet confirmed.
Verdict invalidated if price falls below 25.10.
- Ideal entry range: 25.10 to 25.73
- Exit target: 26.72
- Stop loss protection: below 25.10
For non-traders, this means the stock is sitting in a waiting zone: the next meaningful move is more likely to come after price leaves the current band, not while it is still stuck inside it.
Summary Data T
| Last price | 25.45 USD |
| Change 1 day / 5 days / 1 month | 0.59% / 0.24% / -1.62% |
| Trend / MA-cross | sideways / none |
| SMA20 / SMA50 | 25.73 / 24.69 |
| RSI (14) / Stochastic %K | 51.1 / 30.5 |
| Bollinger %B / ATR | 33% / 0.65 |
| Support / Resistance 20 days | 25.10 / 26.72 |
| Data as of | 24 September 2026 20:30 WIB |


