UNH Stock Gains 1.00%, Testing Support Level In Focus
On September 25, 2026: price 375.01 USD, trend downtrend, RSI 37.8, support 371.29, resistance 401.01. technical analysis of unh stock.

UnitedHealth Group fell to 375.01 USD on the NYSE, keeping the stock below its short- and medium-term trend lines even after a modest daily rebound. The move matters because it shows the recent bounce has not yet repaired the broader technical damage: price remains under the SMA20 at 387.22 and well below the SMA50 at 401.23, while volume has not been strong enough to signal a convincing shift in control.
Trend & Price Action
The chart shows a stock still trading in a corrective phase rather than a clean recovery. With the price below SMA20 and the SMA20 sloping down -1.06% over five days, the near-term trend is still pointing lower. That slope is important: it tells readers the average price over the last month is not merely flat, but easing downward, which usually means rallies are facing overhead supply from investors who bought higher and are waiting to exit.
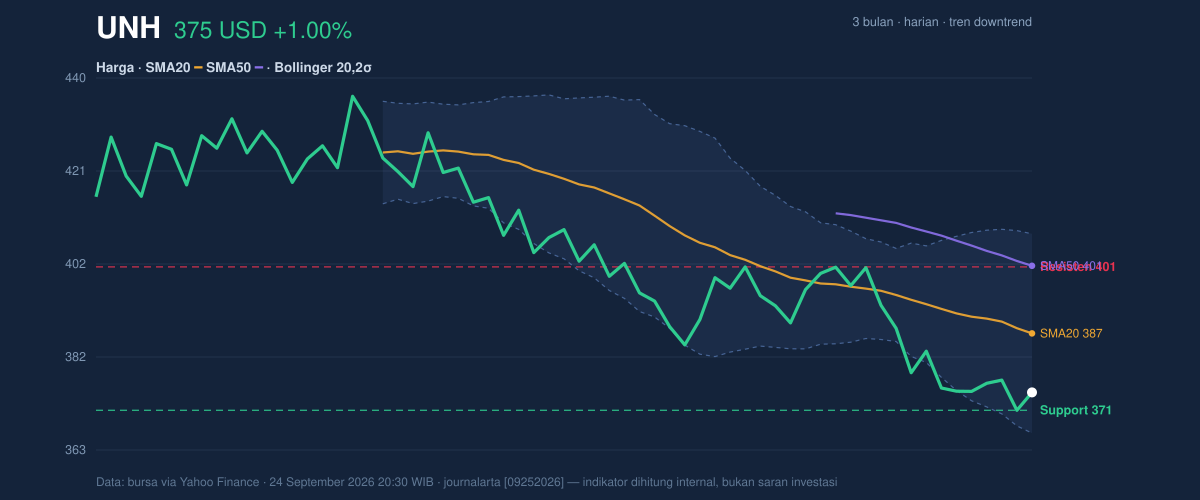
The current price is also sitting in the lower part of its recent range, with support at 371.29 and resistance at 401.01. At roughly 13% of that range from the bottom, the stock is closer to the floor than the ceiling, but not yet at a level that would suggest strong accumulation. The 3-month low at 366.00 is especially relevant because it is only a little below current trading; if that area gives way, the chart would be vulnerable to another leg lower. By contrast, the 3-month high at 461.62 remains far above current levels, underscoring how much ground has been lost since the prior peak.
Oscillators & Momentum
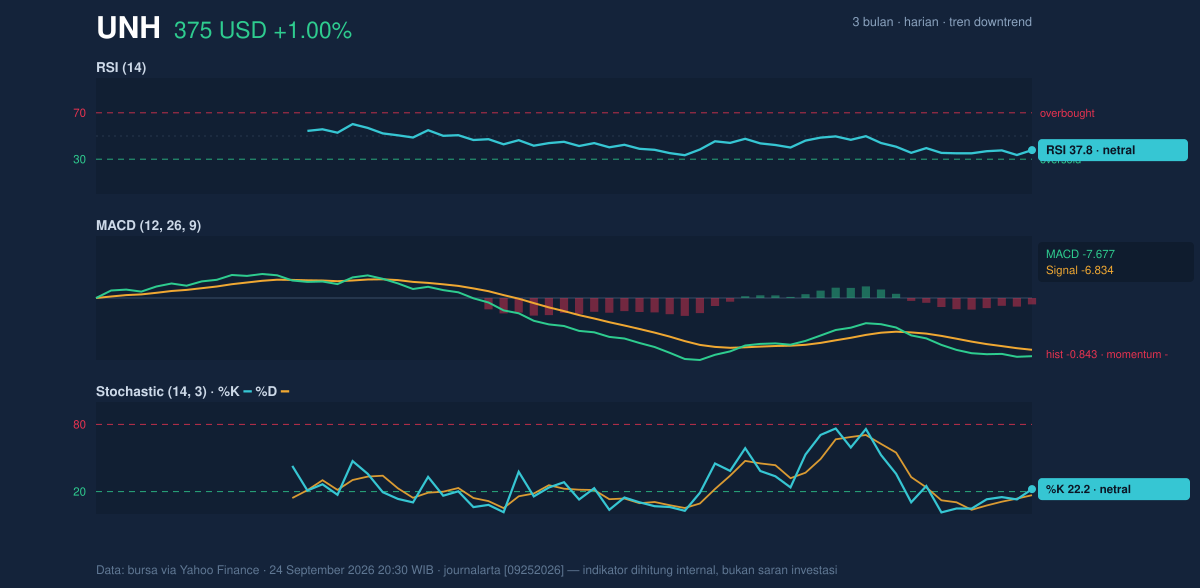
Momentum indicators are mixed, but not in a way that yet favors a durable reversal. The RSI at 37.8 is still technically neutral, but it is leaning toward the weaker side of the scale; in plain English, it says the stock is not oversold enough to scream panic, yet it is also not showing the kind of strength that often precedes a sustained rebound. The Stochastic %K at 22.2 and %D at 16.8 sit near the lower end of the range, which can hint that selling pressure is stretched, but the reading is still best viewed as early-stage stabilization rather than a confirmed turn.
The more decisive signal is the MACD at -7.677, below its signal line at -6.834, with a negative histogram of -0.843. That combination means downside momentum is still dominant: the short-term trend is moving more weakly than the longer-term trend, and the gap between them has not yet flipped positive. For general readers, this is the technical equivalent of saying the stock may be trying to steady itself, but sellers still have the louder voice.
Volatility & Volume
The Bollinger Bands add an important layer to the story. Price is near the lower band at 366.58, with %B at 20%, which means the stock is trading near the lower end of its recent volatility envelope. That often happens when a stock is under pressure, but it can also precede a snapback if selling exhausts itself. The key nuance is that the band width at 10.7% is normal, not compressed. So this is not a classic volatility squeeze that typically precedes a sharp breakout; instead, it suggests the stock is moving within an ordinary range, with room for either a bounce or another drift lower.
Volume does not yet confirm a turning point. The latest session traded 4,651,000 shares, below the 20-day average of 5,050,515, or about 0.9× normal. That matters because rebounds tend to be more convincing when they come with heavier participation. The fact that OBV is falling reinforces the idea that volume flow has not yet shifted in favor of buyers. OBV, or on-balance volume, tracks whether trading activity is accumulating or leaving the stock; a falling line usually means sellers have been more active than buyers across recent sessions.
The ATR at 10.31, equal to 2.8% of price, shows volatility is moderate rather than extreme. In practical terms, that means the stock can still move meaningfully in either direction, but not in a chaotic fashion. It also helps frame risk: price swings of roughly this size are normal enough that traders should expect noise around key levels rather than a straight line.
Key Levels & Scenarios
The near-term line in the sand is 371.29. If the stock holds above that support and starts reclaiming the 387.22 area, the chart would begin to look less fragile because price would be moving back toward the Bollinger middle band and the short-term average. A stronger improvement would require a move through 401.01, where resistance sits near the upper boundary of the recent range and the SMA50 at 401.23 adds extra technical weight.
If, however, the stock loses 371.29 and then slips below the 366.00 three-month low, the chart would likely shift from correction to renewed breakdown risk. That would be a sign that the current base is failing rather than forming.
Technical Verdict: HOLD (wait & see)
HOLD (wait & see)
- MACD remains negative, so downside momentum has not yet reversed.
- Price is below SMA20 and SMA50, keeping the stock in a broader corrective structure.
- Volume is below average and OBV is falling, which does not yet confirm accumulation.
Verdict invalidated if price breaks 366.00.
- Ideal entry range: 371.29 to 387.22, where support and the Bollinger middle band overlap.
- Exit target: 401.01 to 401.23, where resistance and the SMA50 converge.
- Stop loss protection: below 366.00, the 3-month low.
In plain English: the stock is trying to stabilize, but the chart still needs proof that buyers are back in control.
Summary Data UNH
| Last price | 375.01 USD |
| Change 1 day / 5 days / 1 month | 1.00% / -0.07% / -5.44% |
| Trend / MA-cross | downtrend / none |
| SMA20 / SMA50 | 387.22 / 401.23 |
| RSI (14) / Stochastic %K | 37.8 / 22.2 |
| Bollinger %B / ATR | 20% / 10.31 |
| Support / Resistance 20 days | 371.29 / 401.01 |
| Data as of | 24 September 2026 20:30 WIB |

