OCBC Testing Key Resistance: Stock Gains 1.33% (September 28, 2026)
On September 28, 2026: price 32.01 SGD, trend uptrend, RSI 59.3, support 31.00, resistance 32.27. technical analysis of ocbc stock. OCBC Testing Key Resistance…

OCBC Bank’s shares on SGX rose to 32.01 SGD from 31.59 at the previous close, extending a short-term advance that has left the stock near the upper end of its recent range. The move is modest in percentage terms, but the signal matters: price is still trading above SMA20 at 31.63 and well above SMA50 at 30.69, which keeps the broader structure tilted upward even as momentum tools flash a more cautious message.
Trend & Price Action
The chart shows a stock that is still in an uptrend, with the SMA20 sloping higher at 0.51% over five days. That slope is important because it suggests the latest gains are not just a one-day reaction; they are being supported by a rising short-term average, which often acts like a moving floor when buyers remain engaged.
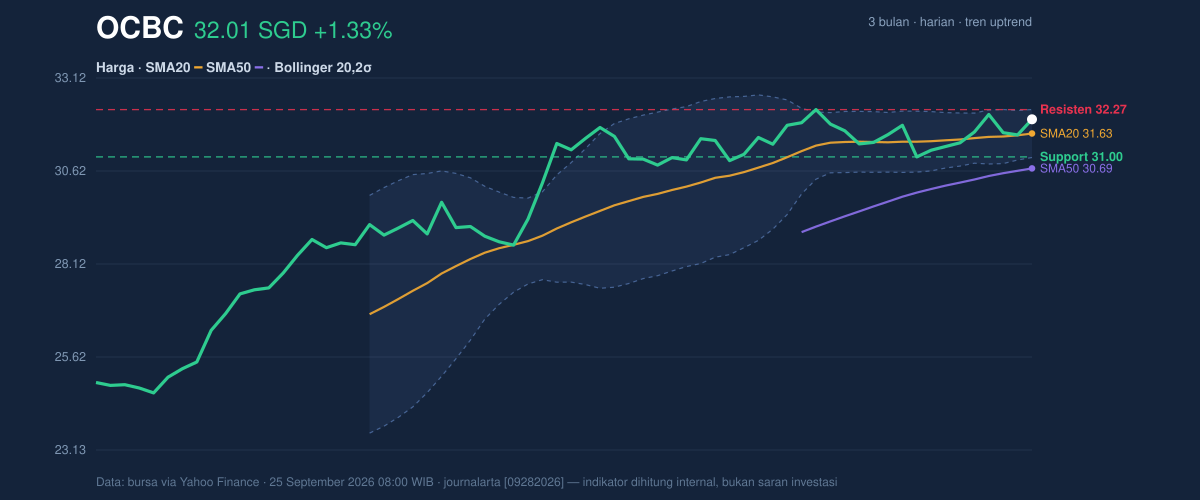
Price is also sitting close to the top of the visible band structure. With the Bollinger upper band at 32.27 and the stock at 32.01, OCBC is trading at about 80% of the recent range. In plain terms, the market is pressing toward the upper boundary, but it has not yet broken through it decisively. The 3-month high at 32.57 is still within reach, while the 3-month low at 24.65 shows how far the stock has already recovered from its earlier base.
The setup is constructive, but not frictionless. The Bollinger band width is only 4.1%, and that narrowing is a classic squeeze signal: volatility has compressed, which often precedes a sharper move. A squeeze does not predict direction on its own; it simply tells investors the stock may be preparing for a larger-than-usual break once one side of the range gives way.
Oscillators & Momentum
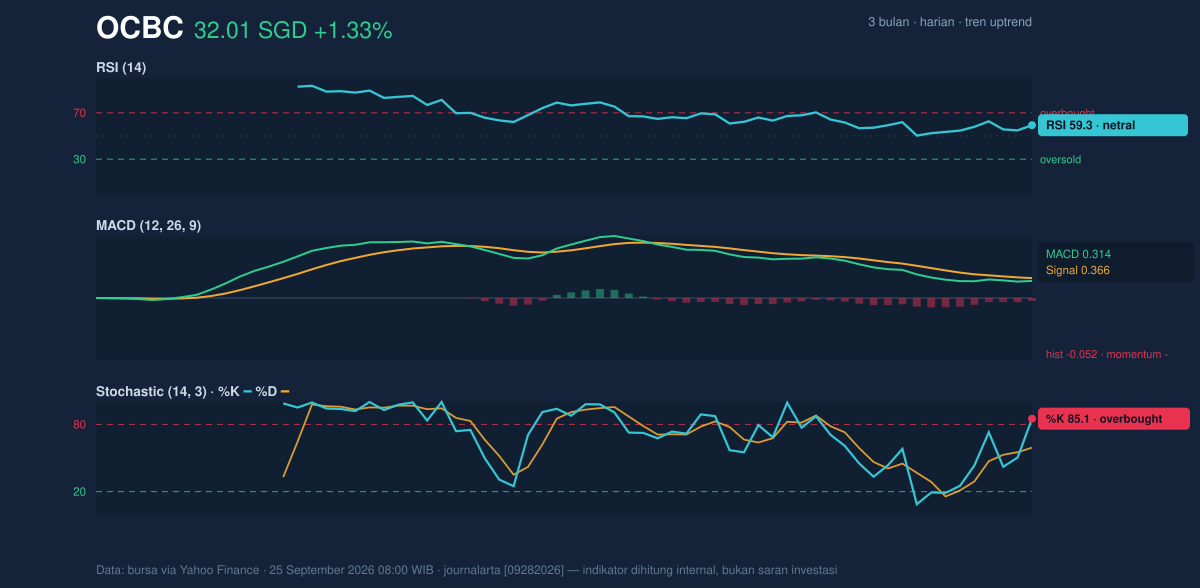
This is where the picture becomes more mixed. The RSI at 59.3 is still neutral, so the stock is not technically stretched on that measure. But the Stochastic %K at 85.1 sits in overbought territory, meaning the latest price action has moved ahead of itself in the short run and may need a pause or pullback before extending further.
The MACD at 0.314 remains above zero, which usually signals that the underlying trend is still positive. Yet the signal line at 0.366 is higher than MACD, and the histogram at -0.052 is negative. That combination matters. It says momentum is still positive in a broad sense, but the rate of acceleration has weakened, and the stock is not currently confirming the price push with fresh momentum strength. In technical terms, price is leading momentum rather than being reinforced by it.
That divergence between a rising price and a softening MACD histogram often shows up when a stock is climbing into resistance. It does not automatically mean reversal, but it does raise the odds of consolidation if buyers do not add volume.
Volatility & Volume
The volatility backdrop is moderate. An ATR of 0.48, or 1.5% of price, suggests daily swings are present but not extreme. Combined with the Bollinger squeeze, this points to a market that is quiet enough to build tension, but not so calm that nothing is happening. The next move could be sharper than recent day-to-day changes if the range breaks.
Volume is the other key clue. Last trade volume of 5,307,900 was below the 20-day average of 5,969,462, or about 0.9× normal. That tells us the latest rise has not yet been backed by unusually heavy participation. In many cases, a breakout is more convincing when volume expands alongside price; here, the move is still running slightly ahead of participation. The OBV is rising, though, which is a constructive sign because it indicates that cumulative volume flow has been improving even if the latest session was not especially busy.
Key Levels & Scenarios
The immediate map is clear. Support at 31.00 is the first level the market is likely to test if the stock loses momentum. That level matters because it sits below the current price but above the lower Bollinger band at 30.98, giving the market a nearby zone where buyers may try to defend the trend. On the upside, resistance at 32.27 aligns with the Bollinger upper band, making it the first obvious ceiling.
If price holds above 31.00 and volume improves, the chart would remain consistent with a gradual push toward the 32.27 area and potentially the 32.57 three-month high. If the stock fails to hold 31.00, the recent advance would start to look more like a short-term exhaustion move rather than a clean continuation. The fact that price is already near the top of the range makes that support level especially important.
Technical Verdict: HOLD (wait & see)
HOLD (wait & see)
- Trend remains positive: price is above SMA20 at 31.63 and SMA50 at 30.69, with the short-term average still rising.
- Momentum is not fully aligned: Stochastic is overbought and the MACD histogram is negative, which argues for caution near resistance.
- Volatility is compressing: the 4.1% Bollinger squeeze suggests a larger move may be coming, but direction is not yet confirmed.
Verdict invalidated if price falls below 31.00, because that would weaken the nearest support and challenge the current uptrend.
- Ideal entry range: 31.00 to 31.63
- Exit target: 32.27
- Stop loss protection: below 30.98
For non-traders, this means the stock still looks technically healthy, but it is close enough to resistance — and momentum is soft enough — that patience matters more than chasing the move.
Summary Data OCBC
| Last price | 32.01 SGD |
| Change 1 day / 5 days / 1 month | 1.33% / 2.01% / 3.03% |
| Trend / MA-cross | uptrend / none |
| SMA20 / SMA50 | 31.63 / 30.69 |
| RSI (14) / Stochastic %K | 59.3 / 85.1 |
| Bollinger %B / ATR | 80% / 0.48 |
| Support / Resistance 20 days | 31.00 / 32.27 |
| Data as of | 25 September 2026 08:00 WIB |


