Singtel Stock Gains 0.71%, Testing Support Level In Focus
On September 28, 2026: price 4.28 SGD, trend sideways, RSI 34.6, support 4.25, resistance 4.56. technical analysis of singtel stock. Singtel Stock Gains — full…

Singapore Telecommunications Ltd. traded at SGD 4.28 on SGX in Singapore, edging up from the previous close of 4.25 even as the broader short-term trend stayed weak and the share price remained below its key moving averages. The move looks modest on the surface, but the chart is sending a clearer message: Singtel is trying to stabilise near the lower end of its recent range, yet the technical backdrop still leans defensive, with momentum indicators not fully confirming the bounce.
Trend & Price Action
As shown in the chart, Singtel is still in a sideways trend with a SMA20 slope of -1.10% over 5 days, which means the near-term path is tilting down rather than building upward pressure. The stock is also trading below both the SMA20 and SMA50 at 4.43, a sign that the recent recovery has not yet reclaimed the average price paid over the past month or so. In technical terms, that usually tells traders the market has not regained control from sellers.
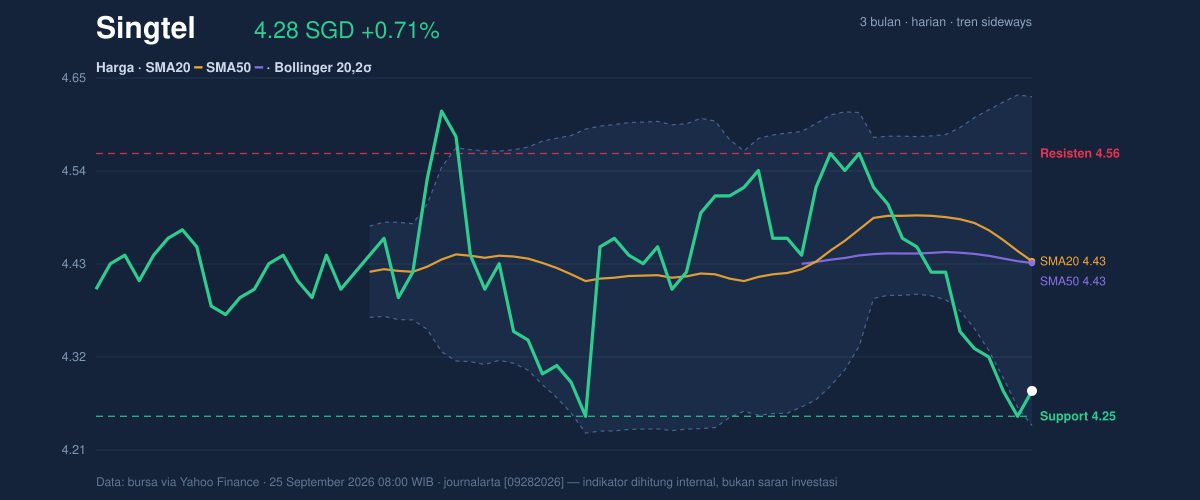
The positioning matters. With the last price at SGD 4.28, Singtel is sitting just above the Bollinger lower band at 4.24 and below the midline at 4.43, which places it in the lower half of its normal trading envelope. It is also near the bottom of the 20-hour support at 4.25, while the 20-hour resistance sits at 4.56. That means the stock is closer to a floor than a ceiling, but it has not yet broken out of the weak zone that has capped it for weeks.
The broader range confirms that view. Over the past three months, the share has traded between 4.19 and 4.70, so the current price is closer to the lower end of that band than the upper end. That does not automatically imply a breakdown, but it does show that buyers have not yet pushed the stock back into the stronger part of its range.
Oscillators & Momentum
Momentum is mixed, and that is where the story becomes more nuanced. The RSI at 34.6 is still technically neutral, but it is close to the oversold zone, which often means downside pressure is easing rather than accelerating. The Stochastic %K at 15.2 and %D at 7.1 are both in oversold territory, suggesting the stock has been sold enough in the short term that a bounce is possible. But a possible bounce is not the same as a confirmed reversal.
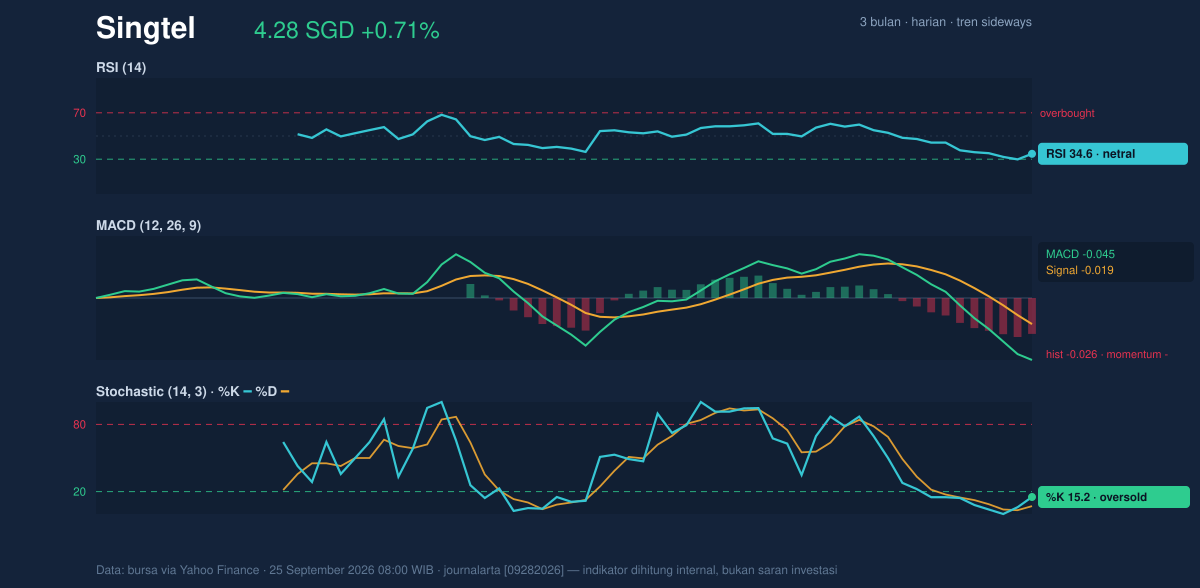
The more cautious signal comes from the trend-following indicators. The MACD at -0.045, below its signal line at -0.019, with a histogram of -0.026, still points to negative momentum. In plain language, the stock may be trying to steady itself, but the underlying trend engine has not flipped positive. That mismatch between oversold oscillators and a negative MACD often appears when a stock is near support but has not yet attracted enough buying to change direction decisively.
Volatility & Volume
Volatility is not especially elevated. The ATR(14) of 0.07, or 1.6% of price, indicates moderate volatility, so the stock is moving, but not violently. The Bollinger Band width of 8.8% is also described as normal, which means the market is not in a squeeze that would often precede a sharp expansion. Instead, Singtel looks like it is drifting within an established band, waiting for a stronger catalyst.
Volume offers little confirmation for the recent rebound. Last trading volume was 17,264,700, below the 20-day average of 20,536,472, or about 0.8× normal. That matters because a price rise on lighter-than-usual participation can be less persuasive than one backed by broad trading interest. The OBV is falling, which suggests that cumulative volume flow has not yet turned in favour of buyers. In chart terms, the stock may be holding up, but not with enough conviction to say demand has clearly returned.
Key Levels & Scenarios
The immediate technical map is fairly clean. Support at 4.25 is the first line to watch, and it sits almost exactly where the shares are trading now. If that level fails, the next reference is the 3-month low at 4.19, which would signal that the stock is losing its recent base. On the upside, resistance at 4.56 is the first hurdle, followed by the SMA20/SMA50 cluster at 4.43 and then the upper Bollinger band at 4.63. A move back above the moving averages would matter because it would show the stock has reclaimed the centre of its trading range, not just bounced from the floor.
The current picture therefore looks like a test of support rather than the start of a full trend reversal. Oversold stochastic readings hint that downside momentum may be stretched, but the negative MACD, falling OBV, and price below the SMA20/SMA50 all argue that the market has not yet proven a sustained recovery. In short, the chart is asking for confirmation, not rewarding anticipation.
Technical Verdict: HOLD (wait & see)
HOLD (wait & see)
- RSI at 34.6 and Stochastic in oversold territory suggest the stock may be stretched on the downside, but not yet reversed.
- Price below SMA20 and SMA50 at 4.43 keeps the short-term trend under pressure.
- MACD remains negative and OBV is falling, which means the recent bounce lacks strong confirmation.
Verdict invalidated if price breaks below 4.19, the 3-month low and the next clear downside reference.
- Ideal Entry Range: 4.25 to 4.28, near support and just above the lower Bollinger band.
- Exit Target: 4.43 first, then 4.56 if momentum improves and the moving averages are reclaimed.
- Stop Loss protection: below 4.19, where the recent range would start to fail.
For non-traders, this means the share is trying to steady itself, but the chart still needs proof that buyers are back in control.
The latest 20-hour resistance stands at 4.56.
Summary Data Singtel
| Last price | 4.28 SGD |
| Change 1 day / 5 days / 1 month | 0.71% / -1.61% / -5.31% |
| Trend / MA-cross | sideways / none |
| SMA20 / SMA50 | 4.43 / 4.43 |
| RSI (14) / Stochastic %K | 34.6 / 15.2 |
| Bollinger %B / ATR | 11% / 0.07 |
| Support / Resistance 20 days | 4.25 / 4.56 |
| Data as of | 25 September 2026 08:00 WIB |


