Death Cross Pressure, Singtel Stock Gains 0.23% Today
On September 29, 2026: price 4.29 SGD, trend downtrend, RSI 36.1, support 4.25, resistance 4.56. technical analysis of singtel stock. Death Cross Pressure —…

Singapore Telecom’s shares on SGX were trading at SGD 4.29 on 28 September 2026 at 08:00 WIB, up slightly from the previous close, but the move sits inside a broader slide that has left the stock below both its short- and medium-term trend lines. The message from the chart is not complicated: Singtel is still trying to stabilize after a weak month, yet the technical setup remains under pressure, with sellers retaining the upper hand even as some momentum gauges begin to look stretched on the downside.
Trend & Price Action
The stock is trading below SMA20 at 4.42 and below SMA50 at 4.43, which matters because prices under both averages usually mean the market is still trading beneath its recent consensus value. More importantly, the chart shows a death cross, where the faster average has moved below the slower one; for readers, that is a classic sign that short-term weakness has become embedded in the trend rather than being just a one-day setback.
The slope of SMA20 at -1.28% over 5 days reinforces that point. A falling moving average is not just a line drifting lower; it signals that recent closes have been consistently soft enough to pull the trend down, and that buyers have not yet forced a reversal. The stock is also sitting near the lower end of its recent range, with the current price at 13% of the 20-hour range, which tells us it is closer to support than resistance, but not yet showing a convincing rebound.
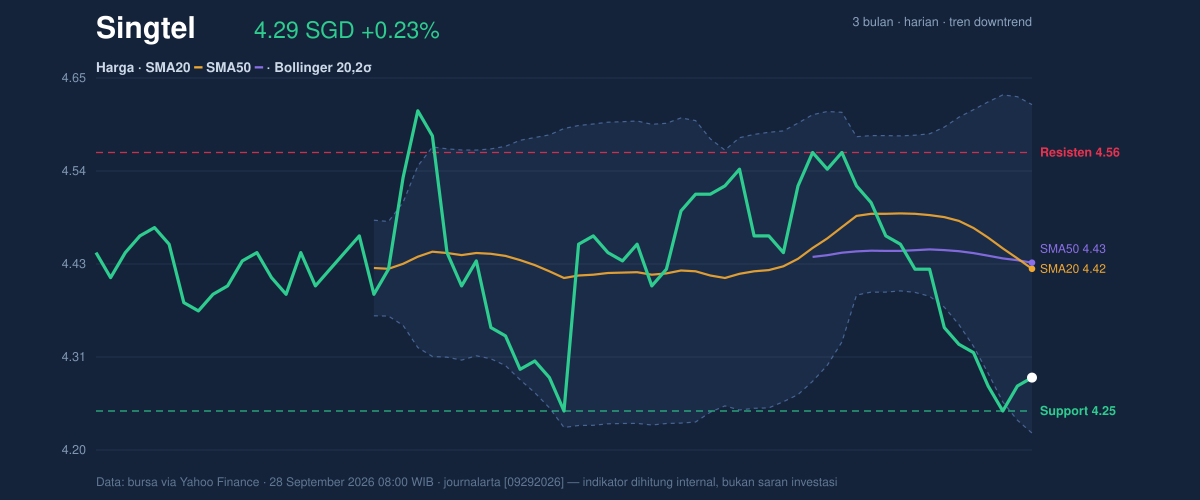
The broader range adds context. Singtel is still above the 3-month low of 4.19, but only narrowly, and remains below the 3-month high of 4.70. That positioning suggests the market has already repriced the shares lower, yet has not found a strong base that would normally attract sustained follow-through buying.
Oscillators & Momentum
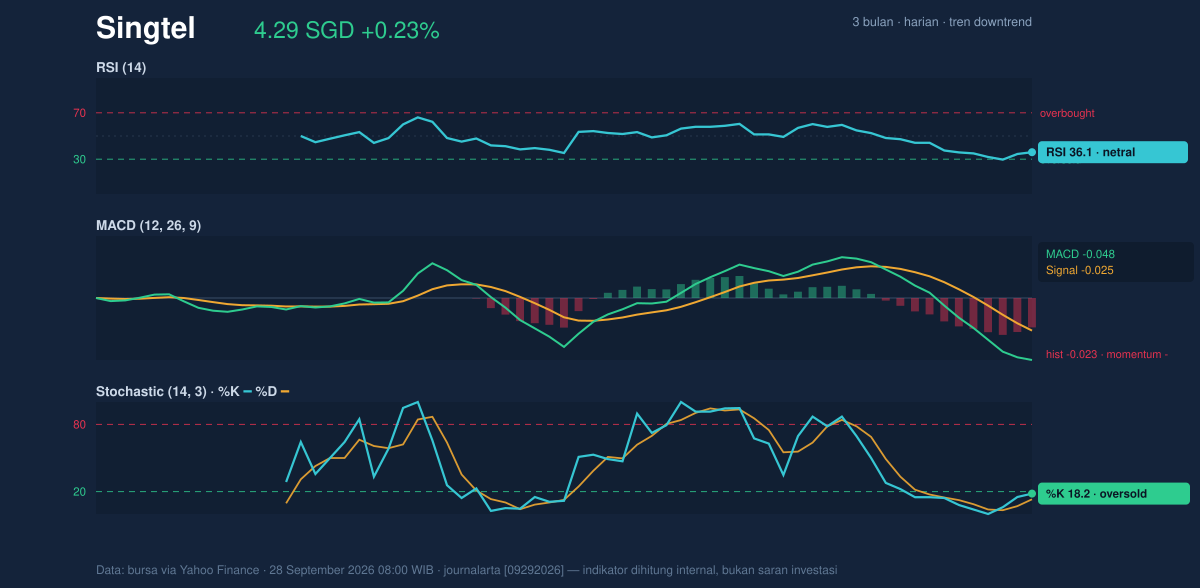
Momentum is mixed, and that is where the story becomes more nuanced. The RSI at 36.1 is neutral, not oversold enough on its own to imply a reversal, but weak enough to show the stock is still under selling pressure. By contrast, the Stochastic reading of %K 18.2 and %D 13.1 is in oversold territory, which means the recent decline has been fast enough to compress short-term momentum. In plain language, the stock may be tired, but tired does not automatically mean it is ready to turn.
The MACD at -0.048, with the signal line at -0.025 and the histogram at -0.023, keeps the bearish case intact. MACD below its signal line means downside momentum still exceeds upside momentum, and the negative histogram shows that gap has not yet closed. That is important because oversold oscillators can precede rebounds, but a negative MACD usually warns that any bounce may still face overhead supply.
This is why the chart should be read as a possible early stabilization attempt, not a confirmed reversal. The oscillators are leaning toward exhaustion, but the trend indicators have not yet followed them.
Volatility & Volume
Volatility is not extreme, but it is high enough to matter. The ATR(14) of 0.07, or 1.5% of price, indicates the stock is still moving enough each day to create meaningful swings, even if the Bollinger Band width of 8.9% is described as normal. That combination usually means the market is not in a volatility squeeze; instead, it is trading in a steady, orderly downtrend with room for incremental moves rather than a sudden breakout.
The Bollinger position is also telling. With price near the lower band and %B at 17%, Singtel is trading close to the bottom of its recent volatility envelope. That often marks an area where short-term traders start watching for a bounce, but it can also indicate a stock that remains weak enough to hug the lower band during persistent selling. The distinction depends on volume, and here volume does not yet confirm a durable turn.
Last session volume was 16,480,600, below the 20-hour average of 19,766,422, or 0.8× normal. That matters because a rebound on lighter-than-average trading often lacks conviction. The OBV is falling, which is a further warning that net money flow has not begun to improve. In other words, the price is trying to hold, but participation is not yet strong enough to call it a meaningful accumulation phase.
Key Levels & Scenarios
The nearest map points are clear. Support sits at 4.25 and resistance is 4.56. With the current price at 4.29, the stock is hovering just above support, which makes this level the key line to watch. A clean hold above 4.25 would keep the door open for a short-term rebound toward the middle Bollinger band at 4.42 and then toward 4.56, where supply has already shown up.
If 4.25 fails, the chart would likely shift back toward the 3-month low of 4.19, a zone that would test whether the recent decline has simply paused or is still unfolding. On the upside, a move through 4.56 would be more meaningful than a minor intraday bounce because it would place the stock back above the recent resistance ceiling and closer to the SMA20 at 4.42 and SMA50 at 4.43 area that now acts as overhead friction.
Technical Verdict: HOLD (wait & see)
HOLD (wait & see)
- Death cross and price below SMA20/SMA50 keep the primary trend negative.
- Stochastic is oversold, but MACD remains negative, so rebound signals are not yet confirmed.
- Volume is below average and OBV is falling, which weakens the case for a durable recovery.
Verdict invalidated if price falls below 4.25, because that would expose the 4.19 low and deepen the bearish structure.
- Ideal Entry Range: 4.25 to 4.29
- Exit Target: 4.42 to 4.56
- Stop Loss protection: below 4.19
In plain English, the stock is sitting at a technical crossroads: weak trend, but close enough to support that a bounce is possible if sellers lose grip at 4.25.
Summary Data Singtel
| Last price | 4.29 SGD |
| Change 1 day / 5 days / 1 month | 0.23% / -0.92% / -5.51% |
| Trend / MA-cross | downtrend / death |
| SMA20 / SMA50 | 4.42 / 4.43 |
| RSI (14) / Stochastic %K | 36.1 / 18.2 |
| Bollinger %B / ATR | 17% / 0.07 |
| Support / Resistance 20 days | 4.25 / 4.56 |
| Data as of | 28 September 2026 08:00 WIB |



