Momentum Gains, NKE Stock Gains 1.79% Today
On September 29, 2026: price 36.39 USD, trend downtrend, RSI 41.4, support 35.51, resistance 39.06. technical analysis of nke stock. Momentum Gains — full…

Nike’s shares rose to 36.39 USD on the NYSE in the latest session, up 1.79% from the previous close, but the move sits inside a broader slide that has already taken the stock 8.11% lower over the past month, according to Yahoo Finance data as of 28 September 2026, 20:30 WIB. The key signal is not the day’s bounce itself, but where it happened: Nike is still trading below its 20-day moving average at 36.94 and well under the 50-day average at 39.53, which means the recent lift is more of a counter-trend rebound than proof that the downtrend has ended. The stock is also sitting in the lower quarter of its short-term range, a position that often reflects caution rather than conviction.
Trend & Price Action
The chart shows a stock that is still technically under pressure. The downtrend is intact, and the SMA20 slope of -2.20% over five days shows that the short-term trend line is still pointing lower, even after the latest gain. That matters because a falling moving average usually tells traders that the market has not yet rebuilt enough demand to change direction. Nike’s price is also below the center of its Bollinger Band set at 36.94, which reinforces the idea that the stock is trading in a weak-to-neutral zone rather than in a strong recovery phase.
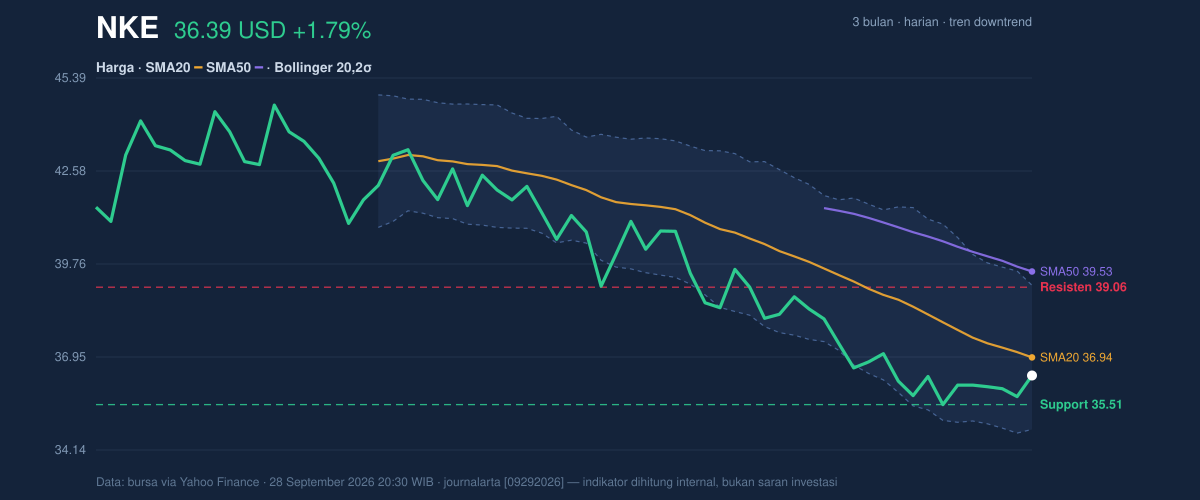
The price is not far from the lower edge of the recent range, but it is not yet pressing into a confirmed breakdown. The 20-hour support at 35.51 and the 3-month low at 35.22 form the nearest floor, while the 20-hour resistance at 39.06 and the upper Bollinger Band at 39.12 mark the first real ceiling. In plain terms: Nike has room to recover, but it still needs to climb through nearby overhead supply before the chart would look healthier.
A short bounce is not the same as a trend change.
Oscillators & Momentum
Momentum indicators are mixed, which is why the latest rise should be treated carefully. The RSI at 41.4 is neutral, but leaning weak; it is not oversold, so the stock is not flashing the kind of exhaustion signal that often precedes a stronger reversal. The Stochastic %K at 44.5 and %D at 26.1 are also neutral, though the faster line above the slower one suggests short-term momentum has improved from a softer base. That is helpful, but it is not yet a decisive bullish signal.
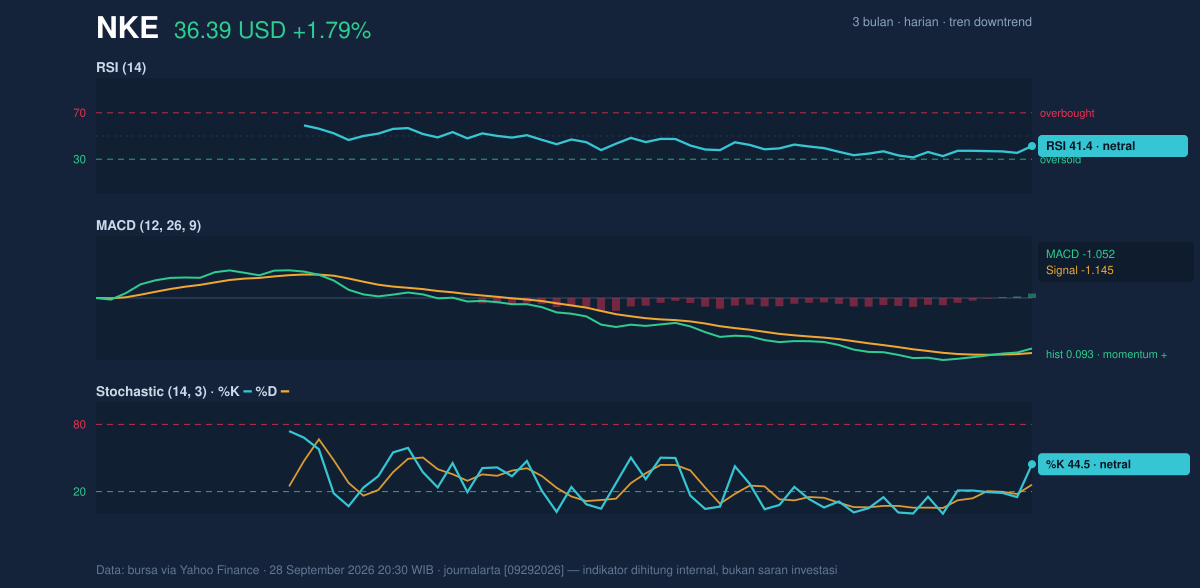
The cleaner positive clue is the MACD at -1.052 versus its signal line at -1.145, with a histogram of 0.093. For general readers, MACD measures whether momentum is improving or weakening; when the histogram turns positive, it means the stock is gaining upward energy even if the broader trend is still negative. In Nike’s case, that matters because it shows the rebound has some internal support. Still, the MACD remains below zero, so the improvement looks like stabilization, not a full trend reversal.
Volatility & Volume
Volatility is moderate rather than extreme. The ATR at 0.94, equal to 2.6% of price, suggests the stock can still move meaningfully in either direction, but without the kind of turbulence that usually signals panic. The Bollinger Band width at 11.8% is described as normal, which means the market is not coiling tightly for a breakout, nor is it in a volatility shock. The %B at 37% shows price is below the middle of the band structure, another sign that Nike is trading in the lower half of its recent envelope.
Volume does not yet confirm a strong shift in sentiment. The latest trade volume of 33,863,600 was only about 1.0x the 20-day average of 32,690,665, so the move higher came on roughly normal participation rather than on a surge of new demand. More importantly, OBV is declining, and that is a warning sign: on-balance volume tracks whether money flow is accumulating or leaving the stock, and a falling line suggests rallies have not yet been backed by sustained buying pressure.
That is the missing piece.
Key Levels & Scenarios
The market is currently trading at 36.39, which places it between support and resistance but closer to the lower end of the range. If price can reclaim the 36.94 SMA20 and then push through 39.06 to 39.12, the chart would start to look less defensive and more constructive. If instead Nike slips back toward 35.51, the market will be testing whether the recent bounce was only temporary. A break below 35.22 would expose the stock’s 3-month low area and would strengthen the case that sellers still control the tape.
Technical Verdict: HOLD (wait & see)
HOLD (wait & see)
- The stock remains in a downtrend and is still below SMA20 at 36.94 and SMA50 at 39.53, so the broader structure has not turned.
- MACD is positive on the histogram, which signals improving momentum, but RSI at 41.4 and Stochastic remain neutral rather than strongly bullish.
- OBV is falling, so the latest rise lacks the volume confirmation that would make a reversal more credible.
- Invalidation: this verdict is invalidated if price falls below 35.22, the 3-month low.
- Ideal Entry Range: 35.51 to 36.94
- Exit Target (Target Price): 39.06 to 39.12
- Stop Loss protection: below 35.22
In plain English: Nike is trying to steady itself, but the chart still needs proof that buyers can hold the line.
“Right now, this is a market asking for confirmation, not assuming it.”
Summary Data NKE
| Last price | 36.39 USD |
| Change 1 day / 5 days / 1 month | 1.79% / 0.80% / -8.11% |
| Trend / MA-cross | downtrend / none |
| SMA20 / SMA50 | 36.94 / 39.53 |
| RSI (14) / Stochastic %K | 41.4 / 44.5 |
| Bollinger %B / ATR | 37% / 0.94 |
| Support / Resistance 20 days | 35.51 / 39.06 |
| Data as of | 28 September 2026 20:30 WIB |



