Momentum Weakens, TMUS Stock Gains 0.62% Today
On September 29, 2026: price 166.45 USD, trend downtrend, RSI 38.9, support 162.41, resistance 188.02. technical analysis of tmus stock.

T-Mobile US is trading in the lower part of its recent range, with the market still leaning cautious even after a modest daily rise. At 166.45 USD, the shares sit below the main short- and medium-term averages, and that matters because it signals sellers still control the broader trend even when the tape turns green for a session.
Trend & Price Action
The stock’s structure is still pointing down. Price is below both the SMA20 at 175.14 and the SMA50 at 178.30, which means the recent rebound has not yet repaired the damage from the prior slide. The downtrend is reinforced by the SMA20 slope of -2.17% over 5 days, a sign that the short-term average itself is falling rather than flattening out. In plain terms, the market is not just cheap relative to recent levels; it is still being repriced lower.
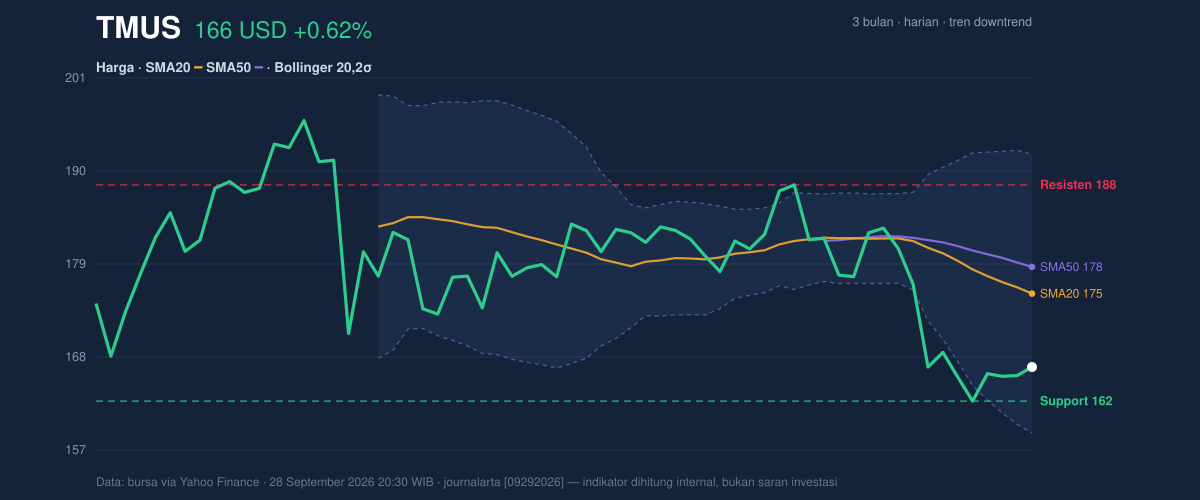
The current quote also sits well below the Bollinger middle band, which is the same as the SMA20 here, and that tells us price is trading under its recent equilibrium. With the stock at 16% of its 20-day range, it is closer to the lower end than the upper end of the band structure. The 3-month low of 161.14 is now not far below the market, while the 3-month high of 198.86 looks distant enough to show how much upside has already been removed from the near-term conversation.
Oscillators & Momentum
Momentum is weak, but not yet in the kind of washed-out condition that often precedes a sharp snapback. The RSI at 38.9 is neutral by the data, yet it sits below the midpoint that traders often watch for balance, which means the stock is still closer to weak momentum than to strength. The Stochastic %K at 21.7 and %D at 18.4 also remain neutral, but they are hugging the lower end of the scale, suggesting the shares are near an oversold zone without fully confirming a reversal.
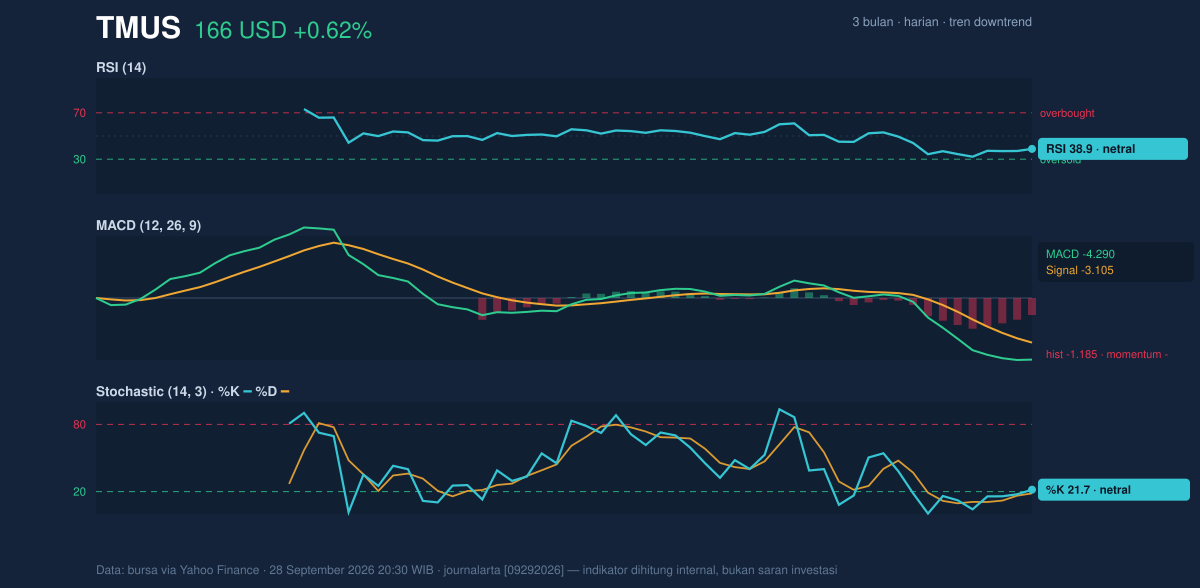
The clearest signal comes from MACD, where the MACD at -4.290 remains below the signal line at -3.105, leaving the histogram at -1.185. That combination means downside momentum is still active, even if it is no longer accelerating aggressively. In practical terms, the stock is not showing the kind of oscillator alignment that usually accompanies a clean trend turn; instead, it looks like a market trying to stabilize while still carrying negative momentum baggage.
Volatility & Volume
Volatility is present, but not extreme. The ATR at 5.24, equal to 3.2% of price, indicates a normal daily swing for a large-cap telecom name rather than a disorderly move. That matters because it suggests the stock can still travel meaningfully in either direction without needing a major catalyst, but it does not imply panic conditions.
The Bollinger setup is also telling. With %B at 24%, price is sitting in the lower quarter of the band range, which usually reflects pressure near the lower boundary rather than broad-based strength. Yet the band width of 18.9% is described as normal, not squeezed, so the chart does not currently show a volatility compression that would typically precede a breakout. In other words, the market is leaning low, but not coiling tightly.
Volume is not confirming an aggressive turn. Last volume of 4,792,300 is below the 20-day average of 5,225,965, at 0.9x normal, which suggests the day’s advance was not backed by unusually strong participation. The OBV is falling, and that is important because on-balance volume tracks whether money flow is accumulating or exiting. A falling OBV alongside a price that remains under its averages says the recent bounce has not yet won the trust of the broader market.
Key Levels & Scenarios
The nearest support sits at 162.41, just below the current price and close to the 3-month low of 161.14. That makes the area between those two numbers the most important near-term test. If that zone holds, it could slow the downtrend and encourage short covering or bargain hunting. If it fails, the chart loses one of its last obvious cushions.
Resistance is more layered and more demanding. The first major ceiling is 188.02, with the Bollinger upper band at 191.66 and the 3-month high at 198.86 above that. This stack matters because it shows the market would need to recover multiple thresholds before the chart could be described as repaired. For now, price remains much closer to support than to resistance, which is another way of saying the burden of proof is still on the bulls.
Technical Verdict: HOLD (wait & see)
HOLD (wait & see) is the cleanest reading from the chart because the stock is weak, but not broken, and the indicators do not yet align strongly enough for a directional reset.
- Reason 1: Price is below the SMA20 at 175.14 and SMA50 at 178.30, while the SMA20 slope is -2.17%, confirming the downtrend.
- Reason 2: MACD is negative with the histogram at -1.185, showing downside momentum is still in place.
- Reason 3: RSI 38.9, Stochastic 21.7/18.4, and %B 24% suggest the stock is near the lower end of its range, but not yet showing a decisive reversal signal.
- Verdict invalidated if price breaks below 162.41, because that would weaken the nearest support and expose the 161.14 3-month low.
- Ideal Entry Range: 162.41 to 166.45, where support and current price overlap.
- Exit Target: 175.14 to 178.30, aligned with the SMA20 and SMA50 resistance zone.
- Stop Loss protection: below 161.14, the 3-month low, to guard against a deeper breakdown.
In plain English, the chart says T-Mobile is trying to steady itself, but the market has not yet shown enough strength to call the turn.
“Right now, the stock is asking for proof, not applause.”
Summary Data TMUS
| Last price | 166.45 USD |
| Change 1 day / 5 days / 1 month | 0.62% / 0.71% / -8.23% |
| Trend / MA-cross | downtrend / none |
| SMA20 / SMA50 | 175.14 / 178.30 |
| RSI (14) / Stochastic %K | 38.9 / 21.7 |
| Bollinger %B / ATR | 24% / 5.24 |
| Support / Resistance 20 days | 162.41 / 188.02 |
| Data as of | 28 September 2026 20:30 WIB |


