PDD Stock Gains 1.19%, Testing Support Level In Focus
On September 29, 2026: price 78.49 USD, trend downtrend, RSI 41.6, support 77.57, resistance 84.00. technical analysis of pdd stock. PDD Stock Gains — full…

PDD Holdings is trading in a market that is still leaning lower, but the latest tape shows buyers are not fully absent. PDD last changed hands at 78.49 USD, up 1.19% on the day, yet the stock remains below its SMA20 at 79.66 and well under its SMA50 at 84.38, a setup that still signals a broader downtrend rather than a clean recovery.
Trend & Price Action
The main message from the chart is straightforward: the stock is trying to stabilize, but it has not yet reclaimed control. The SMA20 is falling, with a -2.34% slope over 5 days, which means the short-term trend is still pointing down even after the session’s bounce. That matters because moving averages are not just lines on a chart; when price sits below them, rallies often face overhead supply from investors who bought higher and may use rebounds to exit.
As shown in the chart, price is below the Bollinger middle band at 79.66 and still inside a normal-width band structure, with the upper band at 83.47 and the lower band at 75.85. That combination suggests the stock is not in a panic selloff, but neither is it in a strong uptrend. The last price is sitting near the lower half of the recent range, with the 20-hour support at 77.57 and resistance at 84.00. In plain terms, the market is waiting to see whether this bounce has enough force to move away from support, or whether sellers will press the stock back toward the lower band.
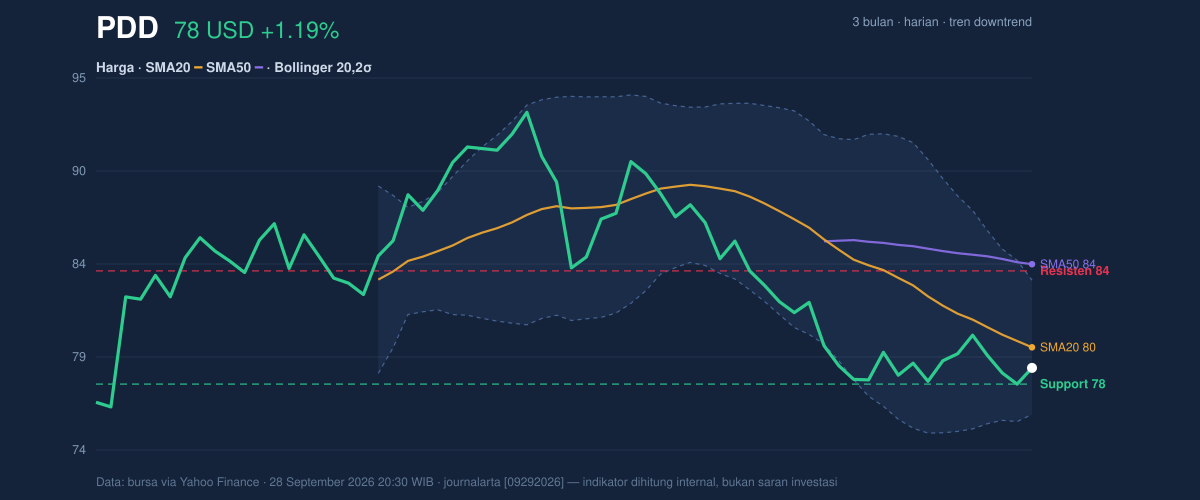
The broader range adds context. The 3-month high is 93.19 and the 3-month low is 75.50, so the shares are trading much closer to the floor than the ceiling. That positioning usually tells investors that sentiment is still cautious, even if the latest session looks better than the prior close.
Oscillators & Momentum
The momentum picture is mixed, and that is the key signal. RSI at 41.6 is neutral, which means the stock is neither deeply oversold nor showing the kind of strong momentum that typically accompanies a sustained breakout. Stochastic %K at 35.3 and %D at 20.3 is also neutral, but the gap between the two lines hints at a modest improvement in short-term momentum. In simple terms, the stock is not overheated; it is trying to lift, but it has not yet proven that buyers are in charge.
The most encouraging detail comes from MACD. MACD at -1.731 is still below zero, which usually keeps the trend label cautious, but the histogram is positive at 0.104 and the signal line sits at -1.834. That means downside momentum is fading even though the trend has not fully reversed. This is often what early stabilization looks like: the stock can still be below trend averages, yet momentum stops getting worse. The chart shows that shift clearly.
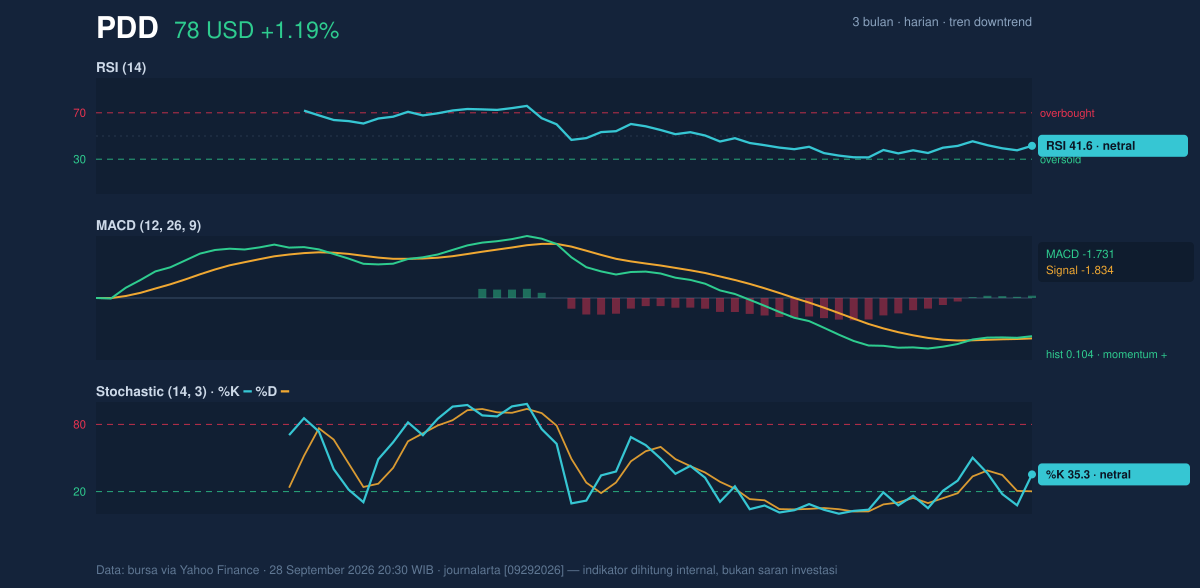
That said, neutral oscillators are not a bullish confirmation by themselves. They simply say the stock has room to move in either direction. When RSI and Stochastic are both in the middle of their ranges, the next decisive move usually comes from price pushing through a nearby support or resistance zone, not from the oscillators alone.
Volatility & Volume
Volatility is present, but not extreme. ATR at 1.63, or 2.1% of price, points to a stock that can move meaningfully in a single session without being disorderly. Meanwhile, Bollinger band width is 9.6%, which is described as normal. That matters because it argues against a compression breakout story right now; the market is not sitting in a very tight coil that often precedes a sharp expansion. Instead, the stock is moving within a fairly ordinary range, which makes nearby support and resistance levels more important.
Volume is the part that tempers the day’s strength. Last volume was 3,656,700, well below the 20-day average of 6,723,170, or about 0.5× normal. That means the rebound happened on relatively quiet trading, which reduces the conviction behind the move. A rally on light volume can still work, but it tends to be less reliable than one backed by broad participation. The one constructive counterpoint is that OBV is rising, suggesting that over time, accumulation may be building even if the latest session was not crowded.
Key Levels & Scenarios
The immediate map is clear. Support sits at 77.57, and that level is especially important because it is both the recent support and the prior close. If price holds above it, the stock can keep building a base. If it fails, the next reference becomes the 3-month low at 75.50, which would signal that the recent stabilization attempt has lost traction.
On the upside, 84.00 is the first resistance to watch, with the SMA50 at 84.38 sitting just above it. That pairing matters because price often hesitates where horizontal resistance and a major moving average cluster together. A move through that zone would not erase the downtrend instantly, but it would show that buyers have enough force to challenge the current structure. As shown in the chart, the stock is still trading well below that barrier, so the burden of proof remains on the bulls.
Technical Verdict: HOLD (wait & see)
HOLD (wait & see)
- Reason 1: price is below SMA20 and SMA50, and the SMA20 slope is negative, so the trend is still weak.
- Reason 2: MACD is negative but improving, with a positive histogram, which signals fading downside momentum rather than a confirmed reversal.
- Reason 3: volume is only 0.5× the 20-day average, so the latest bounce lacks strong participation.
- Invalidation condition: the verdict weakens if price falls below 77.57; a break of that support would expose the 75.50 low.
- Ideal entry range: 77.57 to 79.66
- Exit target: 83.47 to 84.00
- Stop loss protection: below 75.85, with the deeper reference at 75.50
For non-traders, this means the stock is trying to stop falling, but it has not yet shown enough strength to call the turn.
“The market is still asking PDD to prove that this bounce is more than a pause.”
Summary Data PDD
| Last price | 78.49 USD |
| Change 1 day / 5 days / 1 month | 1.19% / -1.02% / -8.40% |
| Trend / MA-cross | downtrend / none |
| SMA20 / SMA50 | 79.66 / 84.38 |
| RSI (14) / Stochastic %K | 41.6 / 35.3 |
| Bollinger %B / ATR | 35% / 1.63 |
| Support / Resistance 20 days | 77.57 / 84.00 |
| Data as of | 28 September 2026 20:30 WIB |


