AMAT Stock Technicals Today: Gains 0.36%, Testing Key Resistance
On September 29, 2026: price 486.76 USD, trend sideways, RSI 55.1, support 415.38, resistance 486.76. technical analysis of amat stock.

Applied Materials is pressing against the top of its recent trading range, a sign that momentum is still alive even as the stock runs into familiar overhead resistance.
Applied Materials, the chip-equipment maker listed on NASDAQ, closed at 486.76 USD, up 0.36% on the day, after gaining 4.85% over five days and 5.43% over one month, according to Yahoo Finance data for 28 September 2026. That matters because the move is not a one-day spike: it shows buyers have been willing to pay up for several sessions, but the stock is also now sitting right where short-term enthusiasm can meet profit-taking.
Trend & Price Action
The broader pattern is still best described as sideways, not a clean breakout trend. The slope of the SMA20 is 0.05%/5days, which is almost flat and tells investors the stock is drifting rather than accelerating decisively in one direction. At the same time, price is above the SMA20 at 453.06 but still below the SMA50 at 489.39, a combination that usually signals a market trying to recover, but not yet fully proving that recovery to medium-term traders.
That split is important. Trading above the shorter moving average says recent buyers have regained control, yet failing to clear the longer average means the stock has not fully escaped the prior balance zone. As shown in the chart, the price is now hugging the upper end of its recent structure, with the 20-hour resistance sitting exactly at 486.76 and the 20-hour support far below at 415.38. In plain English, the stock is stretched near the ceiling of the current range, which often makes the next move more revealing than the last one.
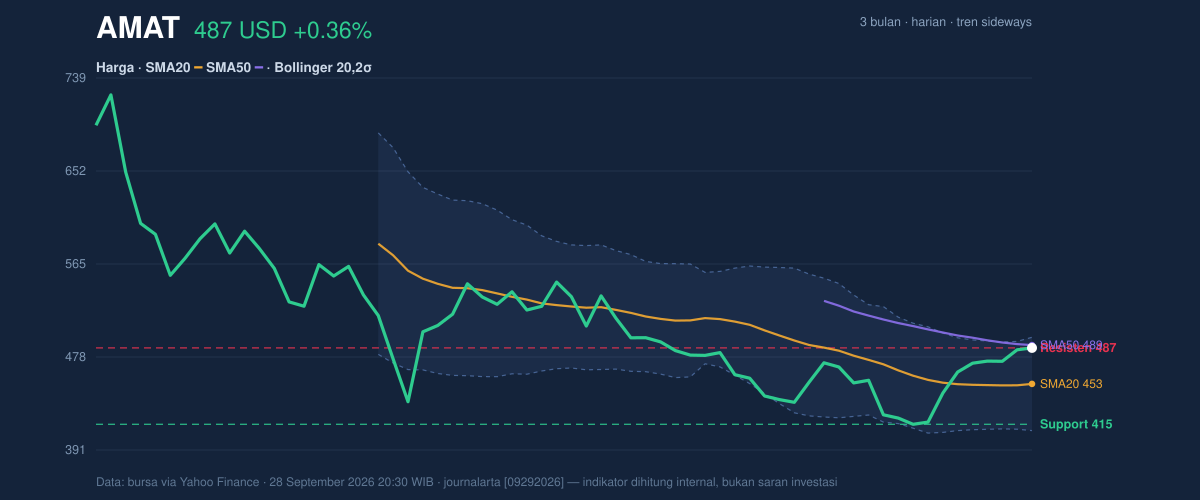
The three-month range adds context. The stock is far below the 3-month high of 739.67 and well above the 3-month low of 411.51, so AMAT is not in a deep selloff, but neither is it near a full recovery of its earlier peak. That position usually points to a market that is still re-pricing the company’s earnings cycle rather than chasing a pure momentum story.
Oscillators & Momentum
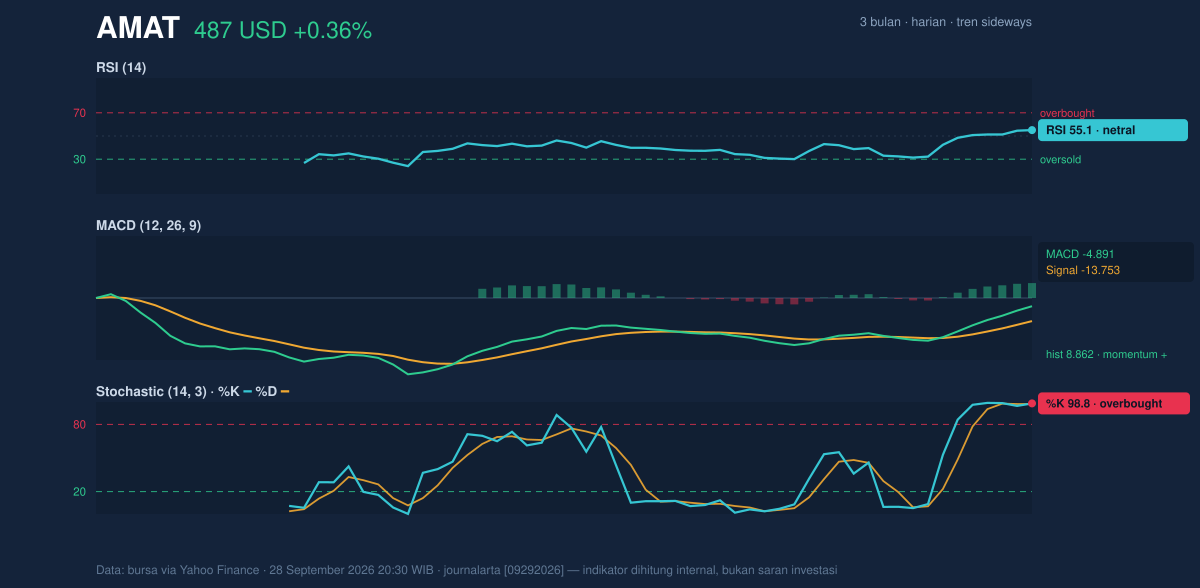
The oscillator picture is mixed, and that is the key signal here. RSI at 55.1 is neutral, which means the stock is neither overbought nor oversold on that measure. By itself, that supports the idea of a market that still has room to move either way.
But the Stochastic %K at 98.8 and %D at 98.1 is a different story. Those readings are deeply overbought, and as shown in the chart, they suggest the stock has advanced so quickly that short-term momentum may be running ahead of itself. For general readers, stochastic is a tool that compares the current price with its recent trading range; when it is near the top of that range, it often warns that the easy part of the move may be over, at least temporarily.
The MACD at -4.891 with a signal line at -13.753 and a positive histogram of 8.862 is more constructive. The histogram turning positive means the gap between the MACD line and the signal line is improving, which often reflects strengthening momentum before price fully confirms it. In other words, the trend engine is warming up, but the overbought stochastic says the stock may need to pause before it can extend cleanly.
Volatility & Volume
Volatility is elevated. The ATR(14) of 18.08, equal to 3.7% of price, says daily swings are still meaningful, so the stock can move quickly once it leaves the current band. That matters because a tight-looking chart can still produce a sharp break if the market decides the next catalyst is important enough.
The Bollinger setup is also revealing. Price is trading near the upper band, with the Bollinger top at 496.63, middle at 453.06, and bottom at 409.50. The %B at 89% shows the stock is close to the upper edge of the band, which often signals strength, but also leaves less room before the market looks extended. The 19.2% band width is normal, so this is not a squeeze setup; it is more of a controlled move inside an already active range.
Volume does not fully confirm the push. Last volume was 5,955,300, below the 20-day average of 6,343,340, or about 0.9x normal. That means the advance happened without heavy participation, which can be a warning flag when price is testing resistance. Still, OBV is rising, and that is a constructive sign because on-balance volume tracks whether money is broadly accumulating the stock over time. The message is subtle but important: buyers are present, yet they have not shown decisive conviction at this exact level.
Key Levels & Scenarios
The nearest technical battle is clear. 486.76 is both the latest close and the current 20-hour resistance, while 489.39 is the SMA50 sitting just overhead. That cluster makes the upper 486.76–489.39 zone a meaningful test. If the stock can hold above that area, the next reference becomes the Bollinger upper band at 496.63, where price would be probing a more obvious extension.
On the downside, the first meaningful reference is the 453.06 SMA20, which also marks the middle Bollinger band. A slip back there would suggest the recent advance is fading into consolidation rather than turning into a trend. Below that, the broader support at 415.38 becomes the line that would show the market has lost much of the recent rebound.
Technical Verdict: HOLD (wait & see)
HOLD (wait & see)
- RSI at 55.1 is neutral, so the stock is not giving a clear directional exhaustion signal.
- Stochastic at 98.8/98.1 is overbought, which warns the short-term move may be stretched near resistance.
- MACD histogram at 8.862 is positive, showing momentum is improving, but price is still below the SMA50 at 489.39, so confirmation is incomplete.
Verdict invalidated if price falls below 453.06, because that would mean the stock has lost its short-term trend support.
- Ideal Entry Range: 453.06 to 486.76
- Exit Target: 489.39 to 496.63
- Stop Loss protection: 415.38
For non-traders, this means AMAT is strong enough to watch, but not yet clean enough to chase with confidence.
“Until the stock can hold above the 489.39 area, this is still a test of endurance rather than a clear breakout.”
Summary Data AMAT
| Last price | 486.76 USD |
| Change 1 day / 5 days / 1 month | 0.36% / 4.85% / 5.43% |
| Trend / MA-cross | sideways / none |
| SMA20 / SMA50 | 453.06 / 489.39 |
| RSI (14) / Stochastic %K | 55.1 / 98.8 |
| Bollinger %B / ATR | 89% / 18.08 |
| Support / Resistance 20 days | 415.38 / 486.76 |
| Data as of | 28 September 2026 20:30 WIB |


