AMAT Stock Technicals Today: Gains 0.14%, Momentum Gains
On Agustus 18, 2026: price 535.31 USD, trend sideways, RSI 45.1, support 436.45, resistance 564.55. technical analysis of amat stock. AMAT Stock Technicals —…

Applied Materials is trading in a market where the message is less about direction than about pressure: the shares are holding above near-term support, but the broader setup still leans cautious because longer-term trend signals have not turned decisively positive.
At 535.31 USD, the stock finished just above the previous close of 534.54, up 0.14% on the day. The move looks modest, yet it matters because it keeps AMAT above its SMA20 at 524.29, even as the SMA50 at 558.89 still sits overhead. That gap tells investors the stock has recovered from short-term weakness, but it has not fully repaired the medium-term damage. In plain language, the price is stabilizing inside a larger range rather than breaking into a clear uptrend.
Trend & Price Action
The chart shows AMAT in a sideways trend, with the SMA20 slope down 1.90% over 5 days. That detail is more important than the day’s small gain. A falling short-term average means recent prices have been drifting lower, so the stock needs more than one positive session to prove that momentum has changed. The absence of a new MA-cross also matters: without a fresh crossover, moving averages are not confirming a trend reversal.
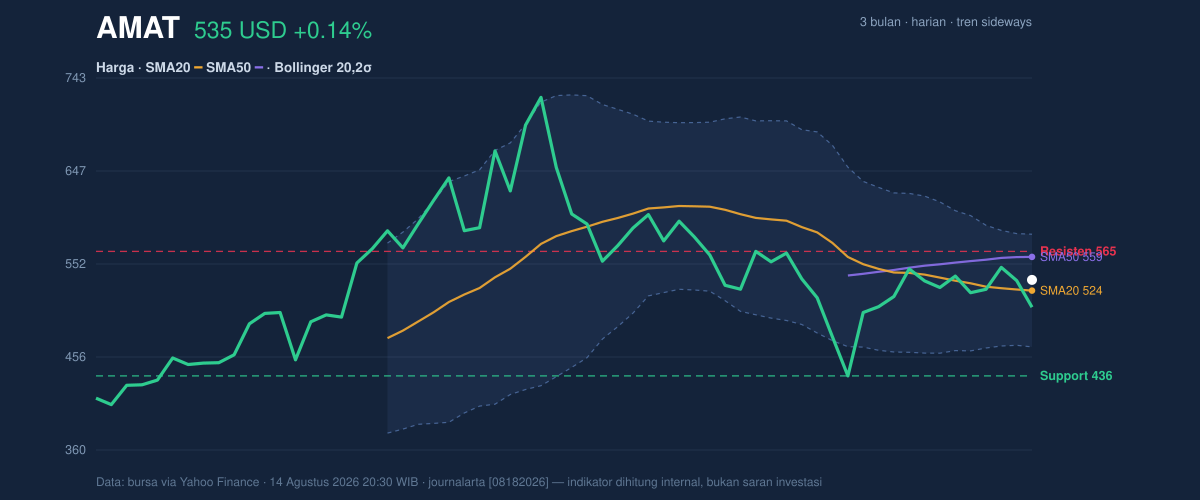
Price is currently positioned at about 77% of the 20-hour range, between support at 436.45 and resistance at 564.55. That placement suggests buyers have been more active than sellers in the near term, but not strongly enough to force a breakout. The broader three-month range, from 397.37 to 739.67, shows how much room the stock has already traveled downward from its upper band. It also shows that the current level is not distressed, but neither is it close to reclaiming the highs that would signal a more convincing trend repair.
The Bollinger Bands reinforce that reading. With the middle band at 524.29, AMAT is above the midpoint, which is constructive. But the upper band at 582.27 remains a meaningful ceiling, and the widening band width of 22.1% points to rising volatility rather than calm consolidation. In other words, the stock is not coiling quietly; it is moving in a way that can produce larger swings in either direction.
Oscillators & Momentum
The momentum picture is mixed, which is why the chart does not yet support a decisive trend call. RSI at 45.1 is neutral, meaning the shares are neither stretched upward nor washed out. That is usually a sign of balance, but it also means there is no strong momentum tailwind. Stochastic %K at 55.6 and %D at 73.7 also sit in neutral territory, though the gap between them suggests the short-term pace has cooled from a stronger position. When Stochastic eases while price holds steady, it often signals that the latest bounce is losing some urgency.
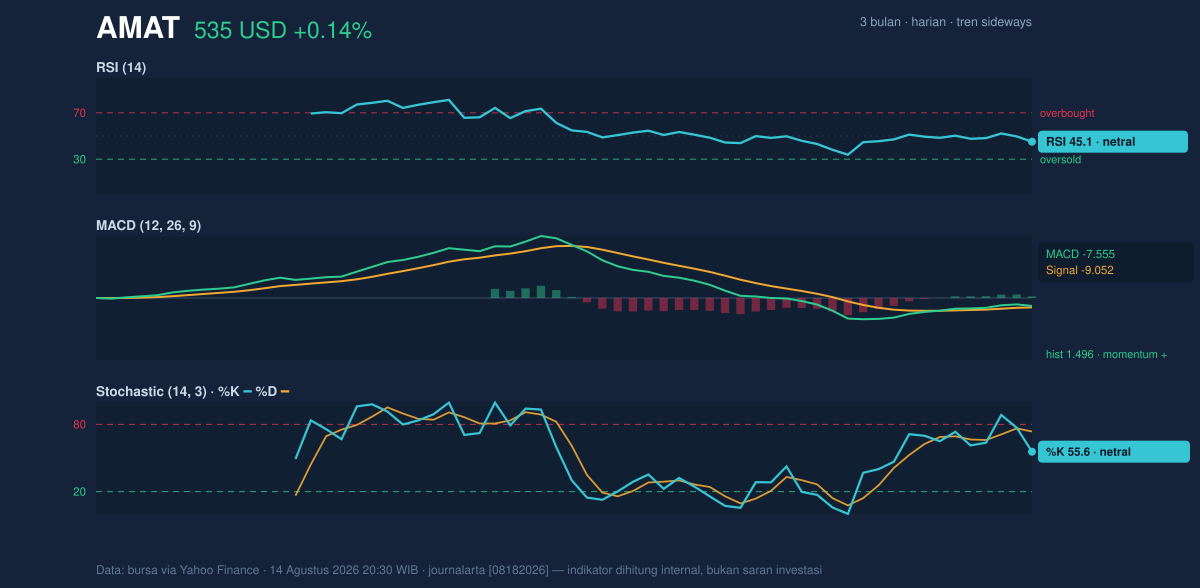
The most encouraging technical feature is the MACD setup. MACD at -7.555 remains below zero, which means the broader momentum backdrop is still negative. But the signal line at -9.052 is lower, and the histogram at 1.496 is positive. That combination indicates momentum is improving even while the trend has not fully flipped. For non-specialists, this is the difference between “less weak” and “strong.” AMAT is not in a full momentum breakout, but the pace of decline has eased enough to show early repair.
Volatility & Volume
The volatility backdrop is unusually active. ATR at 33.98, equal to 6.3% of price, means the stock can move sharply in a single session. That is reinforced by the Bollinger Band expansion. Wider bands generally mean the market expects larger price movement, which raises the importance of nearby support and resistance levels. In periods like this, small headlines or sector moves can have a bigger effect on the share price than they would in a quieter tape.
Volume also sends a cautionary message. Last session’s volume of 13,132,300 was about 1.7x the 20-hour average of 7,719,745, so the move was not happening in thin trade. That is useful because it shows participation. Yet OBV is down, and that weakens the case that recent volume has been accumulating in a bullish way. Rising volume with falling OBV often means that heavier trading has been associated with distribution rather than sustained buying. So while the market is active, it is not fully convinced.
Key Levels & Scenarios
The first level to watch is support at 436.45, because a break below that zone would imply the current range is failing and that sellers are regaining control. On the upside, resistance at 564.55 is the near-term barrier that needs to be cleared before the stock can challenge the higher Bollinger area at 582.27. The fact that price is still below the SMA50 at 558.89 makes that region especially important: reclaiming it would improve the medium-term tone, while rejection there would keep the stock trapped in a sideways-to-cautious pattern.
If AMAT holds above the 524.29 middle Bollinger band and continues to improve momentum, the path toward the 564.55 resistance becomes more credible. If it slips back under 524.29, the chart would suggest the rebound is losing traction and the lower band near 466.31 becomes more relevant as a pressure point.
Technical Verdict: HOLD
HOLD (wait & see)
- RSI 45.1 and Stochastic 55.6 / 73.7 are neutral, so momentum is not strong enough to confirm a clean trend.
- MACD -7.555 is still negative, but the 1.496 histogram shows improvement, meaning bearish pressure is easing rather than ending.
- Price above SMA20 524.29 is constructive, yet the SMA50 558.89 and resistance 564.55 still cap the recovery.
- Verdict invalidated if price breaks below 436.45.
- Ideal Entry Range: 524.29 to 535.31
- Exit Target: 558.89 to 564.55
- Stop Loss protection: below 436.45
For non-traders, that means the stock is improving, but it has not yet proved that the rebound is strong enough to trust.
“The market is active, but it still has to prove that this isn’t just a bounce inside a larger pause.”
Summary Data AMAT
| Last price | 535.31 USD |
| Change 1 day / 5 days / 1 month | 0.14% / -0.71% / 1.07% |
| Trend / MA-cross | sideways / none |
| SMA20 / SMA50 | 524.29 / 558.89 |
| RSI (14) / Stochastic %K | 45.1 / 55.6 |
| Bollinger %B / ATR | 60% / 33.98 |
| Support / Resistance 20 days | 436.45 / 564.55 |
| Data as of | 14 Agustus 2026 20:30 WIB |


