SBUX Stock Gains 0.43% Today, Momentum Weakens
On September 29, 2026: price 95.27 USD, trend downtrend, RSI 33.7, support 93.65, resistance 106.72. technical analysis of sbux stock. SBUX Stock Gains — full…

Starbucks Corp. traded lower on the NASDAQ, with SBUX last at $95.27 on 28 September 2026, as the shares continued to sit below their short- and medium-term trend lines. The move was small on the day, but the broader message from the chart is more important: the stock is still working through a downtrend, and the recent bounce has not yet changed that structure.
Trend & Price Action
The price is trading below the 20-day SMA at $99.14 and further under the 50-day SMA at $103.05, which tells investors the stock remains below the levels that usually separate short-term weakness from a cleaner recovery phase. The 20-day moving average is also sloping down at -3.12% over five days, a sign that the trend is still pointing lower rather than flattening out.
That matters because moving averages are not just lines on a chart; they show where recent buyers and sellers have been willing to transact. When price stays under both averages, rallies often get treated as selling opportunities until the stock can reclaim those bands and hold them. There is no new MA-cross, so there is no fresh technical signal that the trend has reversed.
The stock is also trading near the lower half of its recent range. As shown in the chart, the 20-hour support at $93.65 is close by, while the 20-hour resistance at $106.72 sits well above current levels. The shares are positioned only about 12% into that range, which means the market is still leaning toward the lower end of the band rather than testing the upper boundary.
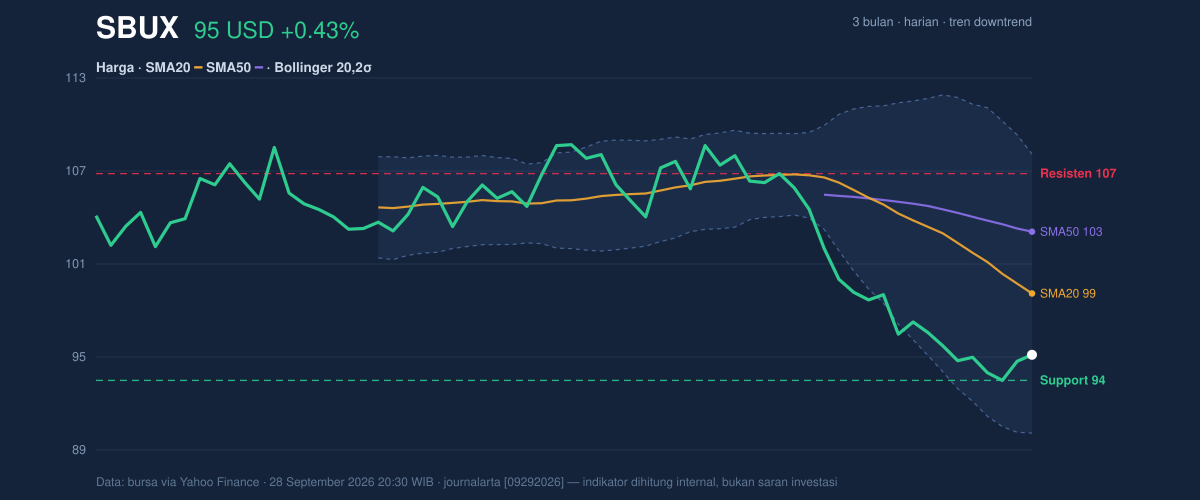
The three-month range adds context: the stock’s 3-month high is $110.51 and the 3-month low is $92.76. With the last price only modestly above that low, the chart suggests the recent decline has not fully stabilized.
Oscillators & Momentum
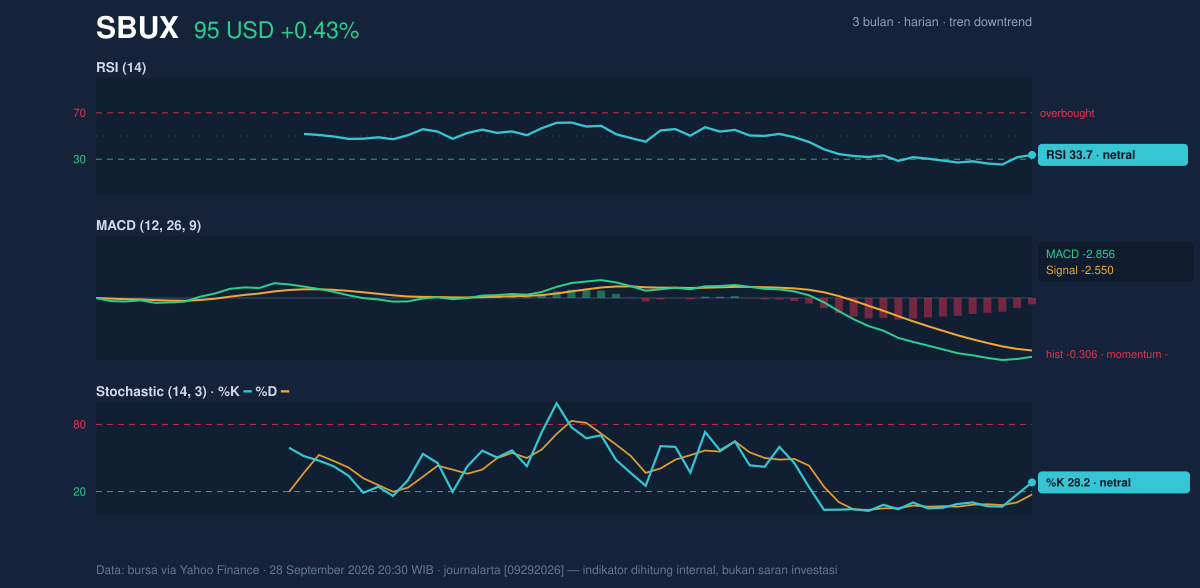
Momentum indicators are not signaling a strong rebound yet, but they are also not showing a deeply oversold breakdown. The RSI at 33.7 is near the lower end of neutral territory. In plain language, that means the stock has been weak enough to lose momentum, but not weak enough to say sellers are exhausted. The Stochastic %K at 28.2 and %D at 17.4 also point to subdued momentum, with the faster line still below the slower line. That setup usually reflects a market that is fragile, even if it is not in free fall.
The more important signal is from MACD. The MACD at -2.856 sits below the signal line at -2.550, and the histogram at -0.306 remains negative. This combination means downside momentum is still dominant, even if the move is not accelerating aggressively. In practical terms, the trend has not yet produced the kind of momentum shift that would normally confirm a durable recovery.
Volatility & Volume
Volatility is present, but not extreme. The ATR(14) at 2.16, equal to 2.3% of price, indicates the stock can still move meaningfully in either direction on a typical session, but not in a panic-like fashion. The Bollinger Bands help frame that behavior: the upper band is $107.96, the middle band is $99.14, and the lower band is $90.32. With %B at 28%, the price is sitting in the lower portion of the band structure, which usually means the stock is closer to the weak side of its recent trading envelope than to a momentum breakout.
The Bollinger band width of 17.8% is described as normal, so this is not a squeeze setup waiting to explode. Instead, the chart shows a market that is still in a fairly ordinary volatility regime, with room to move but no compression signal that often precedes a sharp break.
Volume adds a cautionary note. The latest session traded 7,418,900 shares versus a 20-day average of 6,894,935, or 1.1x normal. That is enough to show participation, but not enough to call it a decisive volume surge. More telling is that OBV is falling, which means volume flow has been favoring distribution rather than accumulation. In technical terms, that weakens the case for a sustained bounce because price gains are not yet being backed by broad buying pressure.
Key Levels & Scenarios
The most immediate support sits at $93.65, just above the 3-month low of $92.76. That zone is important because it is where the market has recently found enough demand to avoid a deeper slide. If that area gives way, the chart would move into a more fragile technical position, with the lower Bollinger band at $90.32 becoming the next visible reference.
On the upside, the first meaningful resistance is the 20-day SMA at $99.14, followed by the 50-day SMA at $103.05. Those levels matter because the stock has to reclaim them before the chart can shift from defensive to constructive. Above that, the 20-hour resistance at $106.72 and the upper Bollinger band at $107.96 mark the zone where the market would need stronger momentum to prove it has moved beyond a routine rebound.
Technical Verdict: HOLD (wait & see)
HOLD (wait & see) fits the chart because the stock is still in a downtrend, but it is not breaking down decisively from current levels.
- Reason 1: Trend remains weak — price is below the SMA20 at $99.14 and SMA50 at $103.05, with the SMA20 slope still negative.
- Reason 2: Momentum is not confirming a reversal — MACD is negative and below its signal line, while RSI at 33.7 and Stochastic remain subdued.
- Reason 3: Volume flow is not supportive — OBV is down, so the latest price action lacks clear accumulation.
- Verdict invalidated if price breaks below $93.65, because that would threaten the nearest support and bring the lower Bollinger band at $90.32 into focus.
- Ideal Entry Range: $93.65 to $99.14, where support and the 20-day average define the zone.
- Exit Target: $103.05 to $106.72, aligned with the 50-day average and nearby resistance.
- Stop Loss protection: below $93.65, with $90.32 as the deeper technical line in the sand.
For non-traders, this means the stock has stopped falling hard, but it has not yet proven that a real recovery is underway.
Starbucks’ 3-month low is $92.76.
Summary Data SBUX
| Last price | 95.27 USD |
| Change 1 day / 5 days / 1 month | 0.43% / 0.39% / -11.66% |
| Trend / MA-cross | downtrend / none |
| SMA20 / SMA50 | 99.14 / 103.05 |
| RSI (14) / Stochastic %K | 33.7 / 28.2 |
| Bollinger %B / ATR | 28% / 2.16 |
| Support / Resistance 20 days | 93.65 / 106.72 |
| Data as of | 28 September 2026 20:30 WIB |


