NVDA Stock Analysis: Gains 1.68%, Testing Key Resistance
On September 29, 2026: price 228.86 USD, trend uptrend, RSI 58.9, support 210.96, resistance 230.36. technical analysis of nvda stock. NVDA Stock Analysis —…

Nvidia rose on NASDAQ on 28 September 2026, with NVDA last changing hands at 228.86 USD, up from a 225.07 USD previous close as traders kept the shares near the top of their short-term range. The move was modest in percentage terms, but the location matters more than the headline gain: the stock is now pressing into the upper band of its recent trading corridor, where momentum signals often decide whether a rally extends or stalls.
Trend & Price Action
The chart shows a stock that is still in an uptrend, with the SMA20 at 222.32 rising at 1.28% over 5 days and the price staying above the SMA20 as well as the SMA50 at 216.50. That matters because moving averages are less about exact prediction than about direction: when price holds above both, it usually means recent buyers have been willing to pay progressively higher levels rather than waiting for dips to deepen.
There is no fresh MA-cross, which suggests the trend is being carried more by continuation than by a new technical trigger. In plain terms, the market is not reacting to a sudden crossover signal; it is simply staying constructive. The stock is also trading at 92% of its 20-hour range, a position that shows strength but also leaves less room before overhead supply can start to matter.
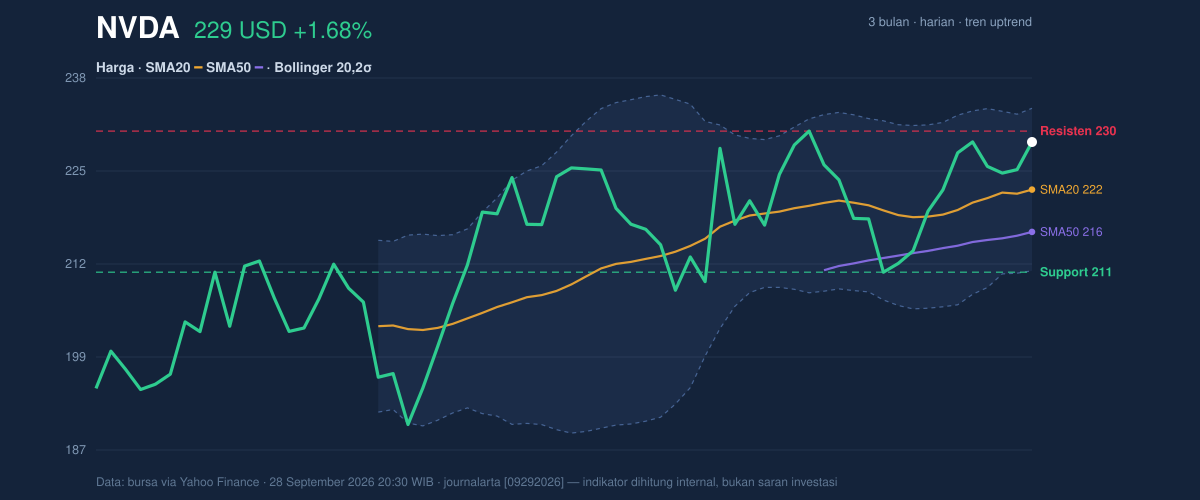
The broader range gives that context: the 3-month high is 234.76 and the 3-month low is 189.80. NVDA is therefore closer to the top of that band than the bottom, which signals confidence, but also means the share price is approaching an area where previous advances have met selling pressure.
Oscillators & Momentum
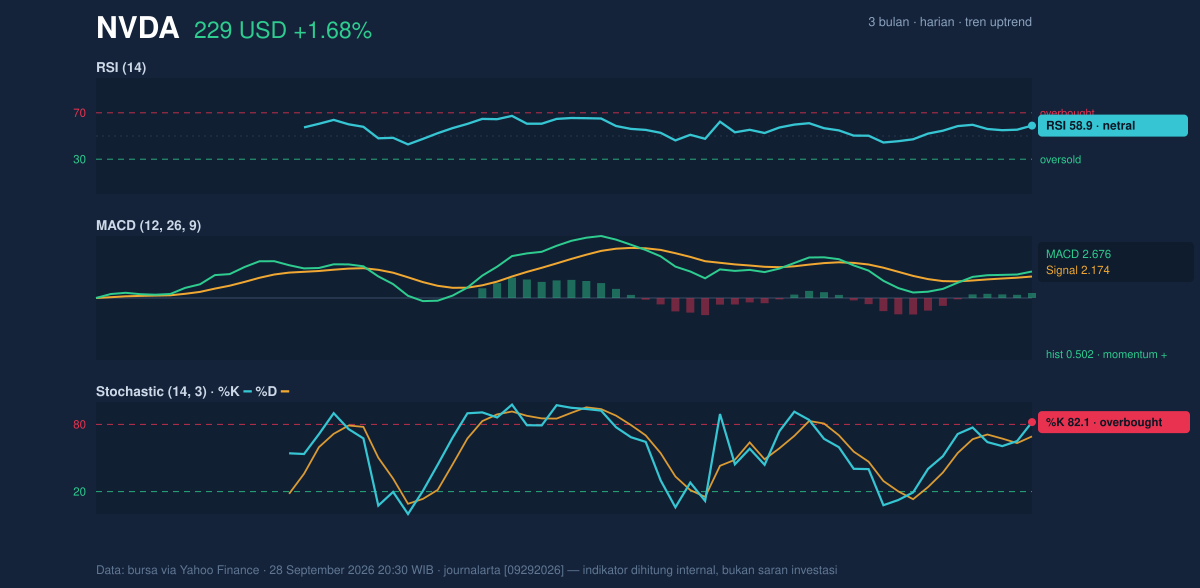
The momentum picture is mixed, and that mix is important. The RSI at 58.9 is still neutral, which usually means the stock is not yet stretched enough to imply an exhausted move. But the Stochastic at 82.1 / 69.3 is overbought, telling a more immediate story: the latest push has been strong enough that short-term traders may already be crowded into the move.
That split between RSI and Stochastic often appears in trending stocks. RSI tends to reflect broader momentum, while Stochastic is more sensitive to recent closes near the top of the range. Here, the message is that NVDA still has trend support, but it is also getting close to a zone where it may need consolidation before the next leg. The MACD at 2.676 versus a signal line at 2.174, with a 0.502 histogram, remains positive. That confirms the trend is not just price drifting upward; the rise is still backed by improving internal momentum.
Volatility & Volume
The Bollinger Bands add another useful layer. NVDA is trading near the upper half of the band structure, with the upper band at 233.49 and %B at 79%. That means price is elevated within the recent volatility envelope, but not yet fully pinned to the top. The 10.1% band width is described as normal, which suggests this is not a squeeze setup waiting for an explosive break; instead, it looks like an established trend moving inside a fairly standard volatility regime.
The ATR(14) at 5.17, or 2.3% of price, indicates moderate volatility. That is a practical signal: daily swings are large enough to matter, but not so wide that the chart is disorderly. Volume supports the move as well. Last volume was 141,544,300, above the 20-day average of 113,388,900, or 1.2× normal, and OBV is rising. In market terms, that means the advance has participation behind it rather than being driven by thin trading. Rising OBV is especially important because it implies shares are being accumulated on balance, not just bouncing on low conviction.
Key Levels & Scenarios
The nearest technical floor is the 20-hour support at 210.96. That level matters because it sits below both moving averages and would likely be the first place where buyers try to defend the trend if momentum fades. On the upside, the immediate ceiling is the 20-hour resistance at 230.36, with the Bollinger upper band at 233.49 and the 3-month high at 234.76 forming a tighter cluster of overhead barriers.
If NVDA clears 230.36 and sustains above it, the chart would be signaling that the market is willing to price beyond the recent range high area. If it fails there, the overbought Stochastic reading suggests the stock could pause or retrace back toward the middle of the Bollinger structure around 222.32. The key point is that the trend remains constructive, but the reward-to-risk balance is less forgiving after a move to the top of the range.
Technical Verdict: HOLD (wait & see)
HOLD (wait & see)
- MACD is positive, so the broader momentum trend is still supportive.
- Price is above SMA20 and SMA50, confirming the uptrend remains intact.
- Stochastic is overbought and price is near 20-hour resistance at 230.36, which raises the odds of a pause.
Verdict invalidated if price falls below 210.96.
- Ideal Entry Range: 222.32 to 210.96
- Exit Target: 230.36 to 233.49
- Stop Loss Protection: below 210.96
For non-traders, that means the stock still looks strong, but it is close enough to resistance that patience matters more than chasing the move.
The newest price on the tape was 228.86 USD.
Summary Data NVDA
| Last price | 228.86 USD |
| Change 1 day / 5 days / 1 month | 1.68% / 0.65% / 5.20% |
| Trend / MA-cross | uptrend / none |
| SMA20 / SMA50 | 222.32 / 216.50 |
| RSI (14) / Stochastic %K | 58.9 / 82.1 |
| Bollinger %B / ATR | 79% / 5.17 |
| Support / Resistance 20 days | 210.96 / 230.36 |
| Data as of | 28 September 2026 20:30 WIB |


