Momentum Weakens, XOM Stock Gains 1.20% Today
On September 29, 2026: price 162.52 USD, trend sideways, RSI 52.6, support 158.30, resistance 169.32. technical analysis of xom stock. Momentum Weakens — full…

ExxonMobil edged higher on the NYSE to 162.52 USD on 28 September 2026, according to Yahoo Finance data, but the share price is still sitting just below the 20-day simple moving average at 162.77. That matters because it says the recent bounce has improved sentiment without yet proving that buyers have fully reclaimed short-term control; the stock is moving inside a broad sideways pattern rather than launching into a clean trend.
Trend & Price Action
The most important read-through is that XOM remains in a sideways trend, even after gaining 1.20% in the latest session and 2.67% over five days. The stock is also up 3.71% over one month, which tells us the tone has improved, but the slope of the SMA20 at 0.28% over five days still points to only a mild upward drift, not a decisive breakout. In plain terms, the chart is recovering, but not convincingly enough to call it a new trend.
The moving averages are giving a mixed message. XOM trades below the SMA20 but above the SMA50 at 159.73, which usually means the share price is hovering between short-term hesitation and medium-term support. There is no new MA cross, so the chart has not produced the kind of signal that would show a fresh acceleration in either direction. As shown in the chart, the price is sitting near the middle of its recent range, at about 38% of the 20-hour range, which suggests the market is still deciding whether the latest rebound is durable or just a pause inside a wider consolidation.
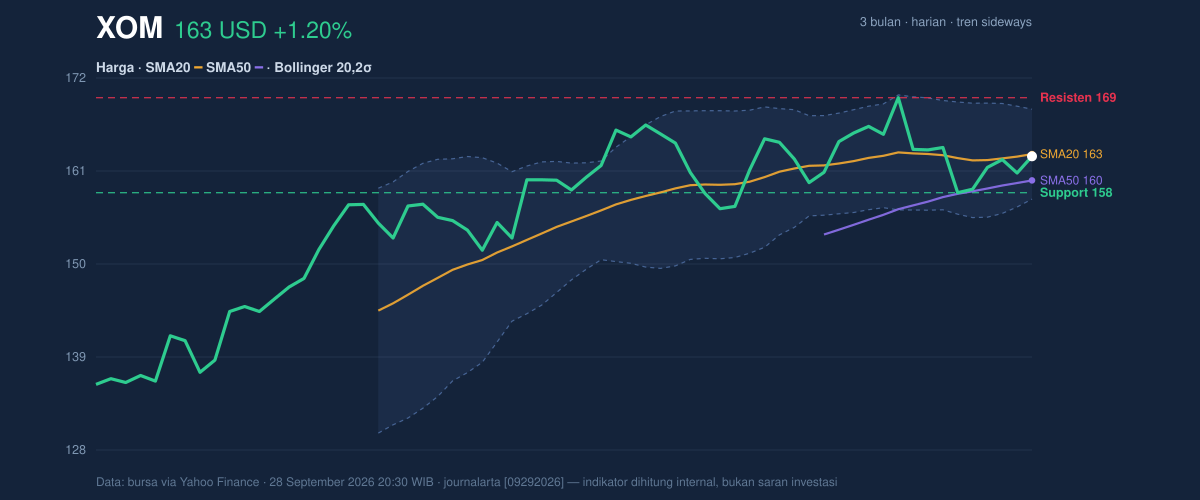
The broader range also matters. XOM is trading well below the 3-month high of 169.64 but far above the 3-month low of 135.33, which reinforces the idea that the stock is neither breaking down nor breaking out. The nearest support at 158.30 and resistance at 169.32 frame the current battle: bulls need follow-through above the upper band of that range, while sellers would gain leverage if the price slips back toward support.
Oscillators & Momentum
Momentum is neutral on the surface but not entirely healthy underneath. The RSI at 52.6 sits in neutral territory, which means the stock is neither overbought nor oversold and can still move in either direction without needing to “cool off” first. The Stochastic %K at 48.4 and %D at 42.8 also point to a balanced setup, with no strong momentum extreme to force a reversal. That combination usually describes a market that is waiting for a catalyst rather than one already committed to a direction.
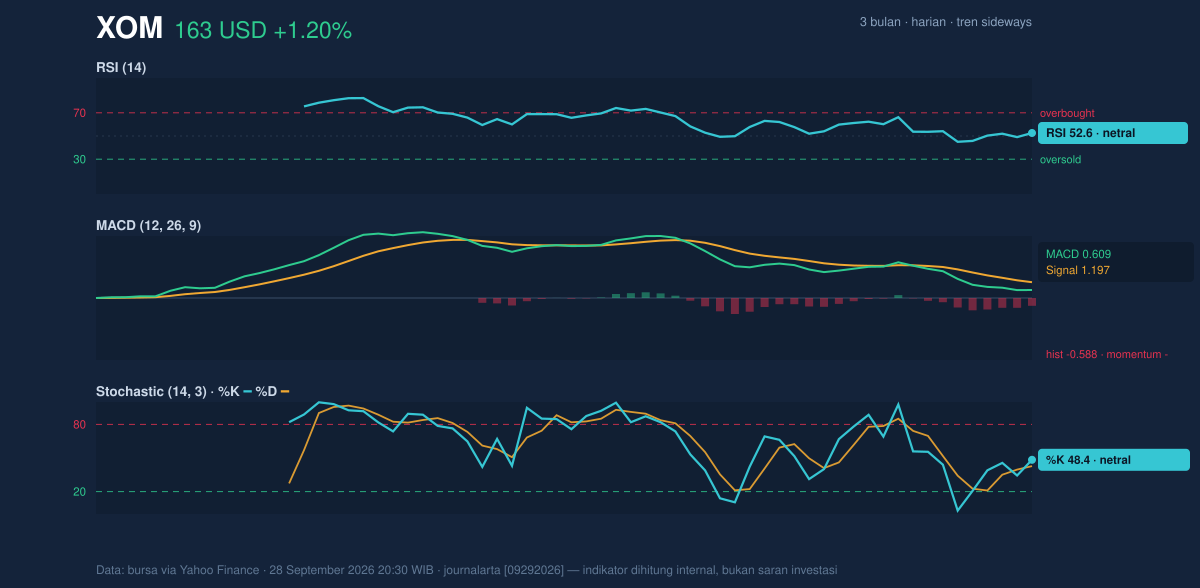
The more cautionary signal comes from MACD. The MACD at 0.609 is still below the signal line at 1.197, leaving a negative histogram of -0.588. That gap means the recent price recovery has not yet translated into momentum confirmation; the move up is happening, but not with enough force to overtake the prior bearish impulse. In practical terms, the chart is saying that the stock can rise, but the move is not yet synchronized with trend momentum. That is often the difference between a steady advance and a rally that stalls near resistance.
Volatility & Volume
Volatility is moderate, but the Bollinger setup suggests the next move could be larger than the recent day-to-day drift. The bands are tightening, with a 6.4% width, and that squeeze often precedes a breakout in either direction. XOM is also sitting near the middle of the band structure, with %B at 48%, which means price is neither pressing the upper band nor testing the lower one. In other words, the stock is compressed in the middle of its recent envelope, and compressed charts tend to resolve with a sharper move once participation increases.
ATR reinforces that point. The ATR(14) of 3.91, or 2.4% of price, indicates moderate daily movement rather than high turbulence. That gives the chart room to move without being chaotic, but it also means a clean break of support or resistance could travel further than traders expect if volume confirms it.
Volume is the one area where the current bounce looks less convincing. The latest session traded 12,809,500 shares, below the 20-day average of 14,591,580, or about 0.9x normal. That is not a strong participation signal. Still, the OBV is rising, which is constructive because it suggests accumulation may be building beneath the surface even though the day’s turnover was lighter than usual. The market is not shouting; it is quietly leaning higher.
Key Levels & Scenarios
The chart’s immediate map is straightforward. Support at 158.30 is the first line that matters, because a break below it would weaken the current rebound and expose the stock to a retest of the lower part of the recent range. On the upside, resistance at 169.32 is the level that would need to give way before the chart could challenge the 3-month high of 169.64. Since the price is also just under the SMA20 at 162.77, that average now acts as a short-term pivot: reclaiming it would improve the tone, while failing to do so would keep the stock boxed into consolidation.
Technical Verdict: HOLD (wait & see)
HOLD (wait & see) fits the current setup because the trend is sideways, momentum is neutral-to-soft, and volume is not yet strong enough to confirm the rebound.
- Reason 1: The price is below the SMA20 even though it sits above the SMA50, which signals mixed short-term and medium-term control.
- Reason 2: The MACD histogram is negative, showing that the recent lift has not fully converted into bullish momentum.
- Reason 3: The Bollinger bands are squeezing, which points to a possible breakout, but direction is not confirmed yet.
Verdict invalidated if price breaks below 158.30, because that would weaken the current base and shift the balance back toward sellers.
- Ideal Entry Range: 158.30 to 162.77
- Exit Target: 169.32 to 169.64
- Stop Loss protection: below 158.30
For non-traders, this means XOM looks steady but unfinished: the chart is waiting for a stronger signal before it shows its hand.
Summary Data XOM
| Last price | 162.52 USD |
| Change 1 day / 5 days / 1 month | 1.20% / 2.67% / 3.71% |
| Trend / MA-cross | sideways / none |
| SMA20 / SMA50 | 162.77 / 159.73 |
| RSI (14) / Stochastic %K | 52.6 / 48.4 |
| Bollinger %B / ATR | 48% / 3.91 |
| Support / Resistance 20 days | 158.30 / 169.32 |
| Data as of | 28 September 2026 20:30 WIB |



