PG Stock Technicals Today: Gains 1.91%, Golden Cross Formed
On September 29, 2026: price 149.03 USD, trend uptrend, RSI 58.7, support 142.64, resistance 149.03. technical analysis of pg stock. PG Stock Technicals — full…

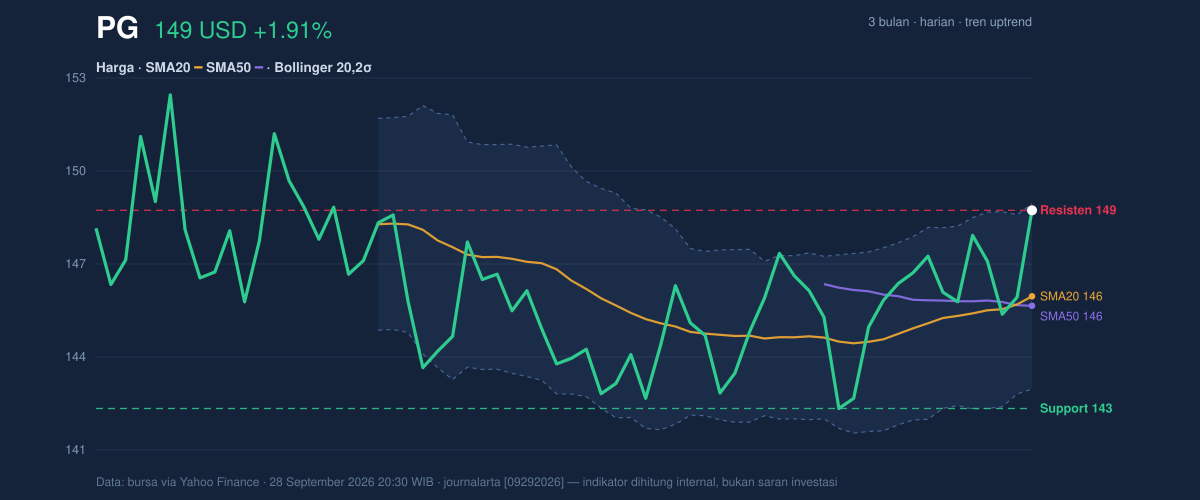
Procter & Gamble (PG) closed at 149.03 USD, up 1.91% on the day and now sitting at the top of its recent trading band, with the stock pressing against the upper Bollinger Band at 149.25. The move matters because it is not just a one-day pop: PG is trading above both its SMA20 at 146.26 and SMA50 at 145.95, while the faster average has crossed above the slower one in a golden cross — a technical signal that usually means the short-term trend has strengthened enough to overtake the medium-term trend. As shown in the chart, the price structure is constructive, but momentum is now stretched, which often changes the meaning of a rally from “building” to “testing.”
Trend & Price Action
The chart shows PG in an uptrend, with the SMA20 rising 0.43% over 5 days. That slope is important: it signals that recent buyers have been willing to pay progressively higher prices, rather than simply reacting to a single catalyst. The golden cross between the SMA20 and SMA50 reinforces that shift, because crossovers tend to matter most when they are supported by price holding above both averages. Here, the last price is not merely above trend lines; it is also at the very top of the 20-hour range, with 149.03 matching the reported resistance level. That tells traders the market has already priced in a lot of the short-term optimism.
Price is extended, not broken.
That distinction is key. PG is still within a healthy trend, but the fact that it is trading at 100% of the 20-hour range means the next move depends less on trend-following and more on whether buyers can absorb supply near the highs. The broader three-month range adds context: the stock has climbed away from the 140.20 low and remains below the 154.32 high, so it is advancing inside a defined corridor rather than entering uncharted territory.
Oscillators & Momentum
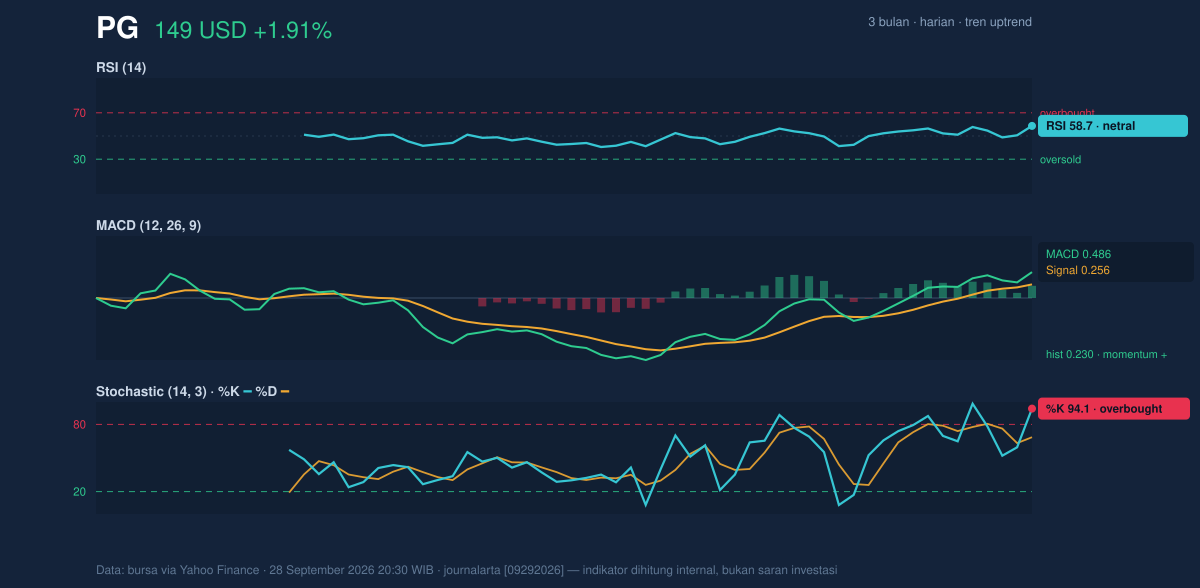
Momentum readings are mixed, which is often what happens late in a short-term advance. The RSI at 58.7 is still neutral, meaning PG is not yet in a classic overbought zone on that measure. But the Stochastic %K at 94.1 versus %D at 68.6 is overbought, and that matters because stochastic is designed to react quickly to short bursts of strength. In plain English, it says PG has risen fast enough that it may need to pause, even if the broader trend remains upward. The MACD at 0.486 above its signal line at 0.256, with a positive histogram of 0.230, shows the underlying trend is still expanding rather than fading.
MACD is positive, while Stochastic is stretched.
That combination usually means the trend is intact, but the pace is vulnerable to consolidation. If MACD is the engine, stochastic is the speedometer; right now the engine is still running, but the speedometer is flashing that the car has been moving quickly. As shown in the momentum chart, this is not a reversal signal by itself, but it does reduce the comfort level of chasing strength after a sharp run.
Volatility & Volume
Volatility is moderate rather than explosive. The ATR(14) at 2.32, or 1.6% of price, suggests PG is moving enough to matter but not enough to imply disorderly trading. That is consistent with a consumer staples name: the stock tends to move more steadily than high-beta sectors, so a moderate ATR can still be meaningful when it occurs near a technical ceiling. The Bollinger Bands also add an important layer: the band width is only 4.1% and is tightening, which often signals a squeeze — a period when price compresses before a larger directional move. Since the last price is near the upper band at 149.25, the squeeze is occurring with price already leaning upward, which can favor continuation if buyers can clear nearby resistance.
Volume supports, but does not fully confirm, the move. Last volume of 8,815,000 is about 1.1× the 20-hour average of 8,199,255, and OBV is rising. OBV, or on-balance volume, tracks whether trading activity is accumulating in the direction of price. A rising OBV alongside a rising price usually means the advance is being backed by participation rather than just thin trading. Still, the margin above average volume is modest, so the market has not yet shown the kind of force that would make a breakout look decisive.
Key Levels & Scenarios
The most important level on the chart is the current 149.03 resistance, because price is already testing it. Above that, the next reference is the 3-month high at 154.32, which is the nearest clear upside marker from the provided data. On the downside, the first meaningful support is the SMA20 at 146.26, which also matches the middle Bollinger Band at 146.26. That overlap makes it a practical pivot: if PG holds above it, the short-term trend stays orderly; if it loses that area, the market would be signaling that the recent push has run out of momentum. A deeper support sits at 142.64, the 20-hour range floor, and below that the three-month low at 140.20 becomes the broader defense line.
Support at 146.26 is the line that defines the trend.
If PG can remain above the middle band and reclaim room above 149.25, the squeeze setup could resolve higher. If it fails to hold 146.26, the message changes from breakout pressure to consolidation risk. The chart is therefore less about whether the trend exists — it does — and more about whether that trend has enough fuel to continue without first cooling off.
Technical Verdict: HOLD (wait & see)
- Reason 1: The trend is constructive, with price above SMA20 146.26 and SMA50 145.95, plus a golden cross confirming short-term strength.
- Reason 2: MACD is positive and OBV is rising, which supports the idea that buyers are still participating.
- Reason 3: Stochastic is overbought and price is pressing the upper Bollinger Band at 149.25, so the stock is extended near resistance rather than offering a clean entry.
- Verdict invalidated if price falls below 146.26, because that would break the key trend support and weaken the current bullish structure.
- Ideal Entry Range: 146.26 to 149.03
- Exit Target: 154.32
- Stop Loss Protection: 142.64
For non-traders, this means PG still looks technically healthy, but it is close enough to resistance that the chart is asking for confirmation, not urgency.
Newest hard fact: volume was 8,815,000 versus a 20-hour average of 8,199,255, or 1.1× normal.
Summary Data PG
| Last price | 149.03 USD |
| Change 1 day / 5 days / 1 month | 1.91% / 2.02% / 3.65% |
| Trend / MA-cross | uptrend / golden |
| SMA20 / SMA50 | 146.26 / 145.95 |
| RSI (14) / Stochastic %K | 58.7 / 94.1 |
| Bollinger %B / ATR | 96% / 2.32 |
| Support / Resistance 20 days | 142.64 / 149.03 |
| Data as of | 28 September 2026 20:30 WIB |



