Testing Key Resistance, LLY Stock Gains 0.11% Today
On September 29, 2026: price 1,184.78 USD, trend sideways, RSI 55.5, support 1,115.70, resistance 1,184.78. technical analysis of lly stock.

Eli Lilly shares edged to $1,184.78 on the NYSE, up 0.11% on the day, as the stock pressed against the top of its short-term trading band, according to exchange data. The move matters less for its size than for its location: the shares are sitting near a ceiling that has repeatedly mattered in recent weeks, while the broader pattern still reads as sideways rather than decisively trending.
Trend & Price Action
The stock remains in a sideways phase, with the SMA20 at $1,151.32 and the SMA50 at $1,177.53. That means the price is holding above both shorter-term averages, but not by enough to suggest a clean acceleration; instead, it is hovering in the space where trend followers and short-term traders often wait for confirmation. The lack of a new moving-average crossover reinforces that message. There is no fresh technical trigger from the averages themselves, only a market that has recovered enough to sit back above the mid-range but has not yet escaped the range.
As shown in the chart, the key point is that the shares are now at 100% of the 20-hour range, with support at $1,115.70 and resistance at $1,184.78. That positioning tells readers the market is testing the upper boundary rather than building a base in the middle. The broader three-month range, from $1,109.15 to $1,292.65, shows there is still room above if momentum turns into a genuine breakout, but the stock has not yet proved it can sustain trade beyond the current ceiling.
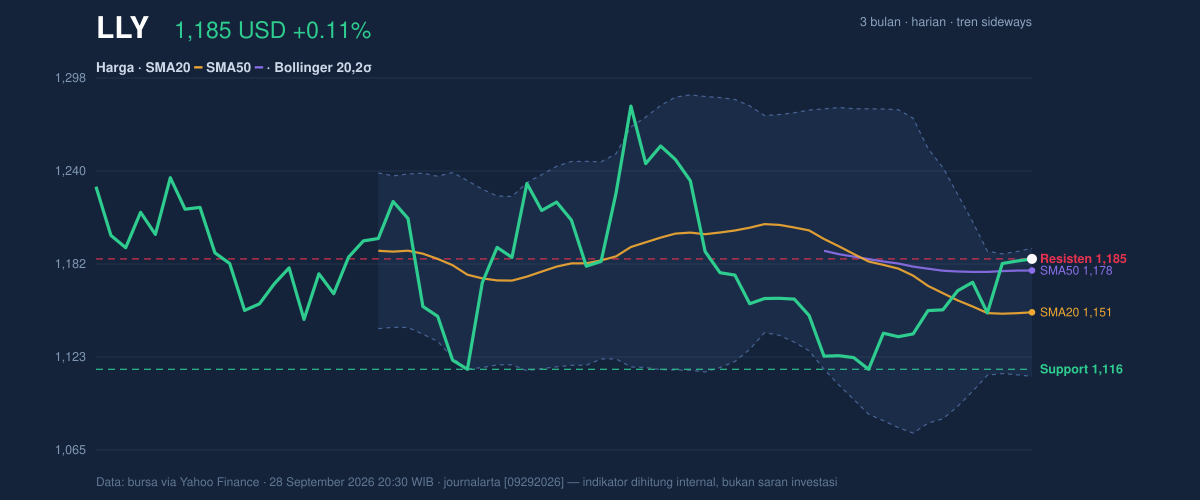
The Bollinger setup sharpens that picture. The upper band sits at $1,191.38, only a few dollars above the latest print, while the band width has narrowed to 7.0%. In plain terms, that squeeze means volatility has compressed, and compressed markets often precede a larger move. The direction of that move is not guaranteed, but the market is clearly coiling rather than expanding. A close above the upper band would be a stronger sign that the recent drift is turning into an advance; failure here would keep the stock trapped in its current range.
Oscillators & Momentum
The momentum picture is mixed, and that mix is what makes this name interesting right now. RSI at 55.5 is neutral, which usually signals that the stock is neither stretched nor washed out. That is important because it leaves room for further upside without the immediate risk of an exhaustion signal from RSI alone. By contrast, the Stochastic oscillator at 84.6 / 82.9 is in overbought territory, which often means the recent climb has moved faster than price can comfortably sustain. Overbought does not automatically mean a reversal, but it does mean the stock is more vulnerable to stalling if buyers hesitate.
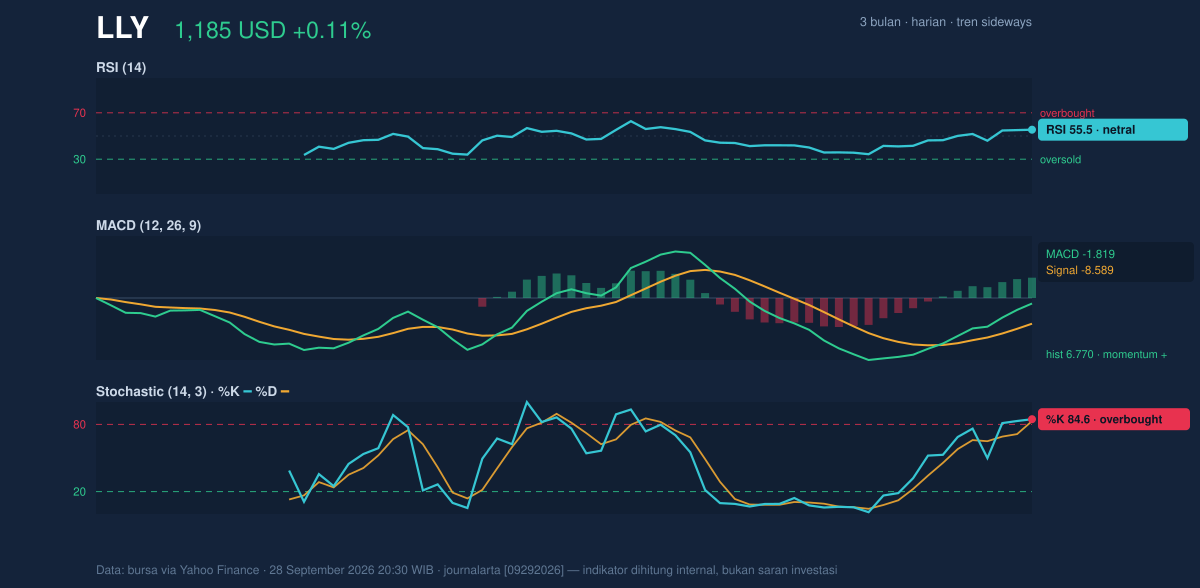
The MACD reading is more constructive. MACD at -1.819 remains below zero, but the histogram at 6.770 is positive, and the signal line sits well below the MACD line at -8.589. That combination usually indicates improving momentum even if the broader trend has not fully flipped into a decisive bullish phase. In other words, the stock is not yet in a clean uptrend on this measure, but the internal pressure is improving. When MACD begins to strengthen while price is already near resistance, it often suggests the market is preparing for a test of whether the ceiling can give way.
Volatility & Volume
Volatility is moderate, not extreme. The ATR at 28.21, equal to 2.4% of price, suggests the stock can move enough to matter without being in a panic phase. That matters because the current Bollinger squeeze and the moderate ATR point to a market that is quiet enough to build tension, but active enough that a break could travel. Volume, however, has not yet confirmed conviction. The latest volume of 1,971,200 is only 0.8× the 20-day average of 2,319,690. That is a caution flag: price is leaning into resistance, but participation is lighter than normal.
The one encouraging participation signal comes from OBV, which is rising. On-balance volume tracks whether money flow is accumulating or fading over time, and a rising OBV suggests buyers have been willing to absorb supply even if the day’s turnover is not especially strong. Put together, that means the market is not showing broad panic selling; it is showing a controlled climb that still needs stronger volume to validate a breakout attempt.
Key Levels & Scenarios
The immediate technical map is straightforward. Resistance at $1,184.78 is being tested now, while the next visible overhead marker is the upper Bollinger band at $1,191.38. Above that, the broader three-month high at $1,292.65 becomes the more ambitious reference point, though the stock is not close enough yet to treat it as an active near-term magnet. On the downside, $1,177.53 from the SMA50 is the first nearby line to watch, followed by $1,151.32 at the SMA20 and then the $1,115.70 support zone.
If the price can hold above the SMA50 and move through the upper band with better volume, the chart would shift from range-bound to breakout watch. If it slips back below the SMA50 and loses the SMA20, the current move would look more like a failed push into resistance than the start of a new leg higher.
Technical Verdict: HOLD (wait & see)
HOLD (wait & see)
- Why: price is above the SMA20 and SMA50, but the trend is still labeled sideways and there is no new MA crossover.
- Why: MACD is positive on the histogram, which supports improving momentum, but Stochastic is overbought, so the stock is pressing into resistance with limited room for error.
- Why: the Bollinger bands are squeezing, which raises breakout potential, yet volume is only 0.8× normal, so confirmation is missing.
- Invalidation: this verdict is invalidated if price falls below $1,151.32 and fails to reclaim the SMA20.
- Ideal Entry Range: $1,151.32 to $1,177.53
- Exit Target: $1,191.38
- Stop Loss protection: $1,115.70
In plain English: the stock is close to a breakout, but not yet convincing enough to call the move finished.
“Right now, the chart is asking for proof.”
Summary Data LLY
| Last price | 1,184.78 USD |
| Change 1 day / 5 days / 1 month | 0.11% / 1.71% / 0.87% |
| Trend / MA-cross | sideways / none |
| SMA20 / SMA50 | 1,151.32 / 1,177.53 |
| RSI (14) / Stochastic %K | 55.5 / 84.6 |
| Bollinger %B / ATR | 92% / 28.21 |
| Support / Resistance 20 days | 1,115.70 / 1,184.78 |
| Data as of | 28 September 2026 20:30 WIB |



