Testing Key Resistance, PANW Stock Gains 4.63% Today
On September 29, 2026: price 392.09 USD, trend uptrend, RSI 59.7, support 328.48, resistance 393.30. technical analysis of panw stock. Testing Key Resistance —…

Palo Alto Networks rose to 392.09 USD on NASDAQ, up 4.63% from the previous close of 374.74. The move matters because it pushed the stock to the top end of its recent trading band, with price now sitting just below a near-term ceiling while momentum remains constructive but stretched. That combination often tells a sharper story than the headline gain itself: the trend is still intact, yet the stock is starting to look technically crowded.
Trend & Price Action
The broader setup remains positive. PANW is trading above both its SMA20 at 361.94 and SMA50 at 357.19, which signals that recent buyers are still in control and that the medium-term trend has not broken down. The SMA20 is rising, with a slope of 1.97% over 5 days, and that upward tilt is important: it shows the short-term average is not just being defended, but pulled higher by price action.
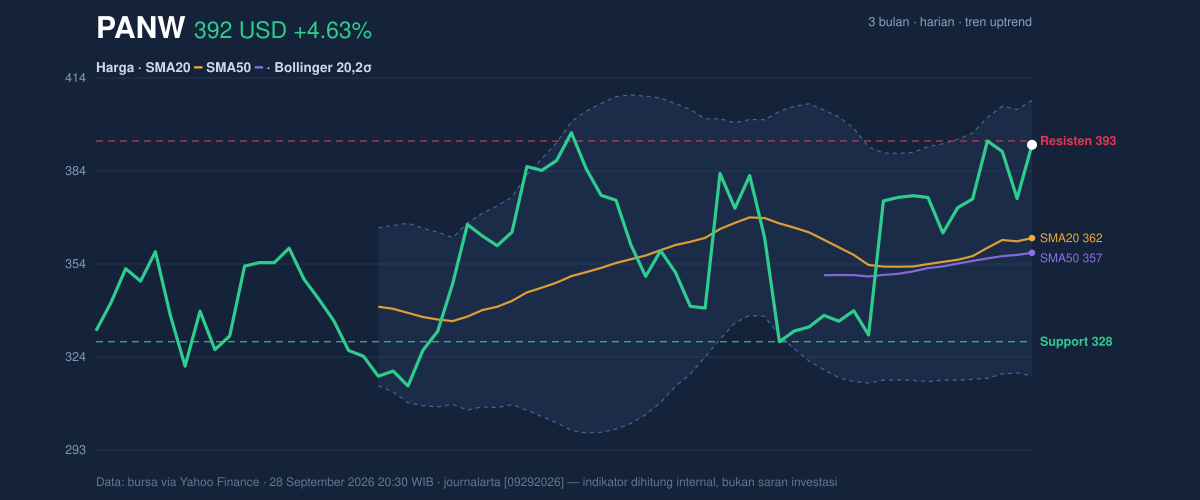
As shown in the chart, the stock is now very close to its 20-hour resistance at 393.30 and is trading at about 98% of its 20-hour range. That means there is little room left before the market has to decide whether to break higher or pause. The 3-month high at 398.88 is the next obvious reference above current levels, while the 3-month low at 305.33 remains far below, confirming that the stock has recovered a large portion of its prior range.
The lack of a new MA-cross is also worth noting. There is no fresh moving-average crossover to reinforce the move, so the trend is being carried more by price staying above the averages than by a new structural signal. In plain terms, the chart is healthy, but not yet showing a fresh acceleration signal.
Oscillators & Momentum
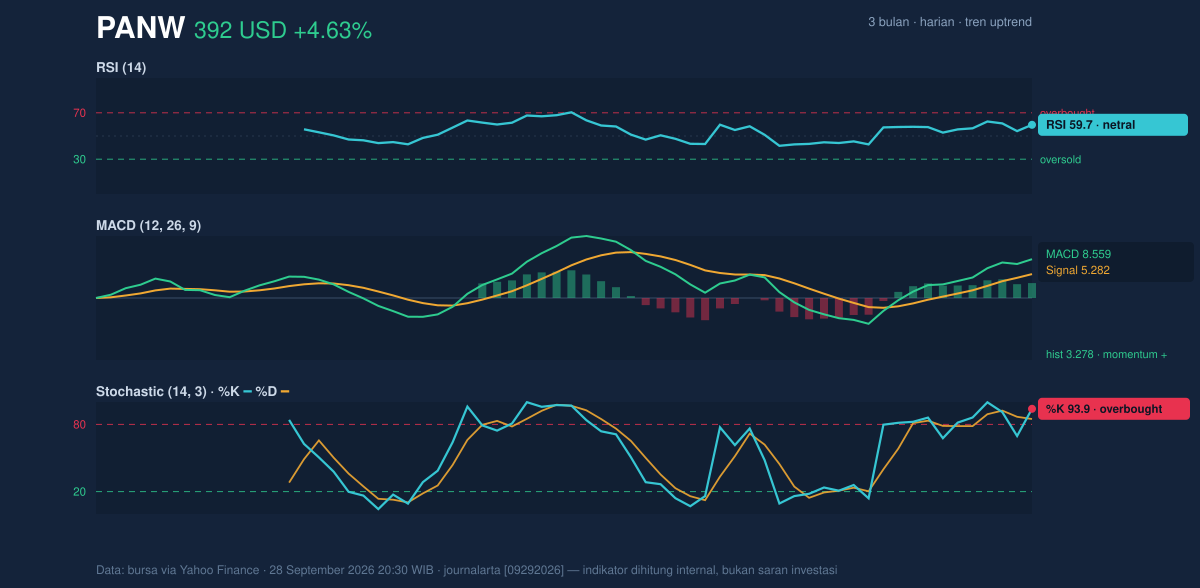
Momentum is positive, but not cleanly balanced. The MACD at 8.559 remains above its signal line at 5.282, with a positive histogram of 3.278. That is a classic sign that upside momentum is still ahead of downside pressure. For readers less familiar with the term, MACD is a trend-following gauge; when it stays above signal and the histogram is positive, it usually means the trend has not yet lost speed.
The caution comes from the oscillators. The RSI at 59.7 is still neutral, which suggests the stock is not yet in a classic overbought state on that measure. But the Stochastic %K at 93.9 and %D at 84.9 are both elevated, with %K above the usual overbought threshold. Stochastic is a faster indicator than RSI, so it often turns first when price has moved too far, too fast. That matters here: the stock may still be trending upward, but the short-term move is stretched and could be vulnerable to a pause or pullback if buyers hesitate.
Volatility & Volume
Volatility is elevated. The Bollinger upper band at 406.43, middle band at 361.94, and lower band at 317.45 show a wide structure, with the band width at 24.6% and expanding. A widening Bollinger channel typically means the market is expecting larger price swings, not smaller ones. In this case, the price is already near the upper band with %B at 84%, which indicates the stock is trading high within the band and may have less near-term upside room before it starts to look extended.
The ATR(14) at 18.36, or 4.7% of price, reinforces that message. ATR measures average daily movement, and a reading this high means traders should expect wider-than-usual swings. That does not automatically mean reversal; it means the stock can move fast in either direction.
Volume adds a subtle nuance. The latest volume of 6,008,900 is below the 20-day average of 7,108,475, roughly 0.8x normal. So while price is advancing, it is not doing so on standout participation. That slightly weakens the breakout quality. The OBV is rising, though, which is a constructive sign because on-balance volume tracks whether volume is generally supporting the trend. In effect, the market is leaning bullish, but not with decisive conviction yet.
Key Levels & Scenarios
The nearest technical pivot is the 20-hour resistance at 393.30. A clean move through that area would bring the 3-month high at 398.88 into focus, and then the Bollinger upper band at 406.43 becomes the next pressure point. If price cannot clear 393.30, the chart leaves room for a pullback toward the SMA20 at 361.94, which also matches the Bollinger middle band and therefore acts as a major trend checkpoint.
On the downside, the 20-hour support at 328.48 is the key floor in the provided data. That level sits well below current price, so it defines the broader risk boundary rather than the immediate one. As long as price remains above the moving averages and the middle Bollinger band, the trend structure stays intact. If it loses that zone, the tone would shift from trending to corrective.
Technical Verdict: HOLD (wait & see)
HOLD (wait & see)
- Price is above SMA20 and SMA50, which supports the trend.
- MACD is positive, showing momentum is still on the bulls’ side.
- Stochastic is overbought and price is near resistance, which raises the odds of a pause rather than an immediate breakout.
Verdict invalidated if price breaks and holds below 328.48.
- Ideal Entry Range: 361.94 to 393.30
- Exit Target: 398.88 to 406.43
- Stop Loss protection: 328.48
For non-traders, this means the stock still looks technically healthy, but it is close enough to resistance that the next move matters more than the last one.
“Momentum is still there, but the chart is asking whether buyers have enough strength left to push through the ceiling.”
Summary Data PANW
| Last price | 392.09 USD |
| Change 1 day / 5 days / 1 month | 4.63% / 5.47% / 5.52% |
| Trend / MA-cross | uptrend / none |
| SMA20 / SMA50 | 361.94 / 357.19 |
| RSI (14) / Stochastic %K | 59.7 / 93.9 |
| Bollinger %B / ATR | 84% / 18.36 |
| Support / Resistance 20 days | 328.48 / 393.30 |
| Data as of | 28 September 2026 20:30 WIB |



