UOB Stock Gains 1.69% Today, Testing Key Resistance
On September 29, 2026: price 43.29 SGD, trend sideways, RSI 63.5, support 40.99, resistance 43.29. technical analysis of uob stock. UOB Stock Gains — full…

United Overseas Bank shares on SGX rose to 43.29 SGD as of 28 September 2026 08:00 WIB, extending a short-term advance that has lifted the stock 1.69% in one day, 2.83% over five days and 4.16% over one month. The move matters because it has pushed UOB to the top of its recent trading band, with price now sitting above both short-term averages and pressing against the upper Bollinger band, a setup that often signals either continuation or a pause as momentum traders and longer-term holders test the next level of conviction.
Trend & Price Action
The chart shows UOB trading in a sideways trend, but with a mild upward tilt in the short term, as reflected by the SMA20 slope of 1.08% over five days. That is not a full trend reversal, yet it does show that buyers have been willing to pay up after a period of consolidation. Price is also above the SMA20 at 41.92 and SMA50 at 42.08, which means the shares are trading above the average cost basis of the past month and the past quarter’s shorter window. In plain language, that usually suggests the market has recovered enough to attract follow-through interest, even if the broader structure is still described as sideways.
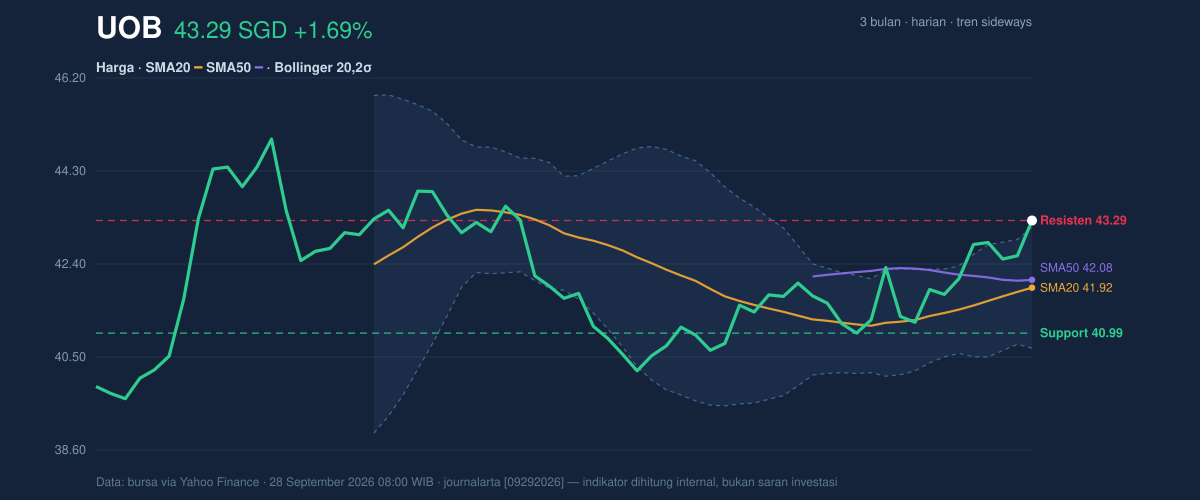
The most important detail in the price structure is that UOB is now at 100% of its 20-hour range, with support at 40.99 and resistance at 43.29. That is a tight position near the ceiling, not the middle. The stock is also close to its 3-month high of 45.15, well above the 3-month low of 39.50, which tells investors the recent rebound has repaired some of the earlier weakness but has not yet proven it can escape the broader range.
Oscillators & Momentum
Momentum indicators are giving a mixed but important message. The RSI at 63.5 is still in neutral territory, which means the stock is not yet in the classic overheated zone by that measure. But the Stochastic %K at 91.8 and %D at 75.8 are already in overbought territory, signalling that the latest push may be running ahead of itself in the very short term. In practical terms, that often means price can keep rising, but the odds of a pause, pullback or choppy trading increase as buyers become more selective.
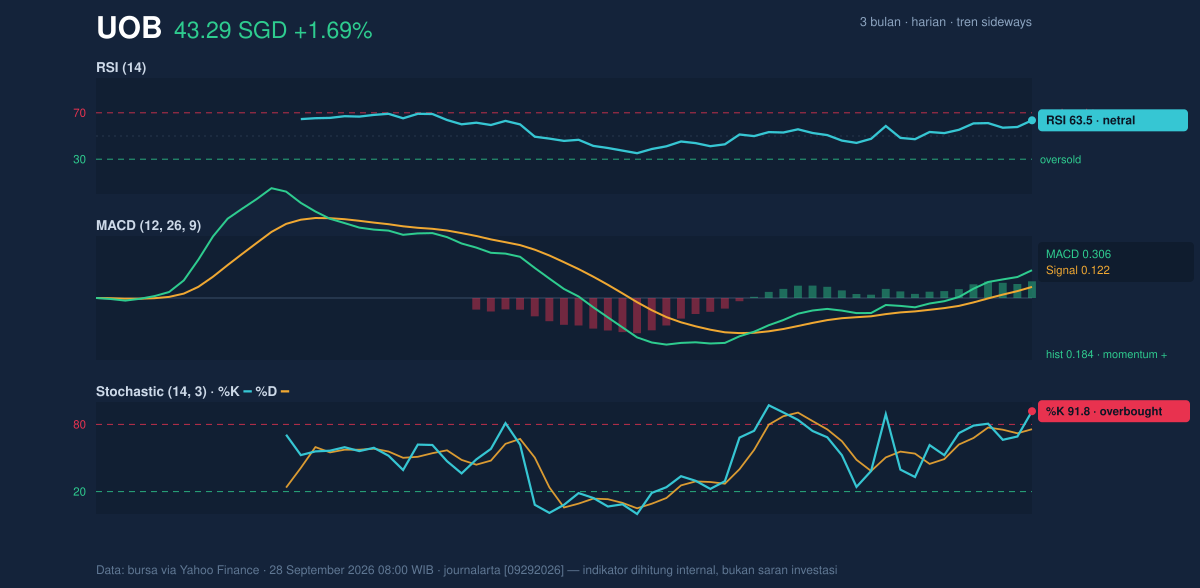
The MACD at 0.306 sits above its signal line at 0.122, with a histogram of 0.184. That is a constructive reading because MACD measures whether recent price action is gaining or losing pace; when the line stays above the signal line, it suggests upward momentum still has the upper hand. The key nuance is that momentum is positive even while Stochastic is stretched, so the chart is showing strength, but strength that may need a breather before it can extend cleanly.
Volatility & Volume
The Bollinger Band picture is especially telling. UOB’s %B at 106% means the stock is trading slightly above the upper band, a sign of near-term strength but also of extension. At the same time, the band width is only 5.9%, described in the data as a squeeze, which usually means volatility has compressed and the market may be preparing for a larger move. When a stock pushes above the upper band during a squeeze, it often indicates pressure is building rather than fading, but it can also produce sharp mean reversion if follow-through volume does not hold.
Volume is helping the bullish case. Last trade volume of 5,711,000 was about 1.8× the 20-hour average of 3,157,873, and OBV is rising. That combination matters because volume confirms whether a move is being backed by participation. A rally on thin volume can be fragile; a rally on heavy volume, with OBV rising, suggests more market participants are leaning in. The ATR at 0.76, or 1.8% of price, points to moderate volatility, so the stock is not in a wild trading phase, but intraday swings are still large enough to matter around nearby levels.
Key Levels & Scenarios
For now, the market is watching whether UOB can hold above the short-term floor near 40.99 while building on the test of 43.29. A clean move through the current ceiling would matter because the stock is already sitting above the upper Bollinger band and the recent volume surge suggests traders are paying attention. If that push stalls, the chart leaves room for a retreat back toward the 41.92 area, where the SMA20 and Bollinger midline sit together and often act as a magnet for price after an extension.
The broader range gives the move context. The stock remains below the 3-month high of 45.15, so there is still overhead space before the chart enters fresh-high territory. But it is also comfortably above the 3-month low of 39.50, which means the recent rebound has already done some technical repair. In effect, the market is no longer pricing UOB like a weak laggard, but it has not yet fully priced it like a breakout story either.
Technical Verdict: HOLD (wait & see)
HOLD (wait & see)
- MACD is positive and above the signal line, which supports the short-term uptrend.
- Volume is 1.8× average and OBV is rising, so the move is backed by participation.
- Stochastic is overbought and price is above the upper Bollinger band, which raises the risk of near-term exhaustion.
Verdict invalidated if price falls below 40.99, because that would break the nearest support and weaken the current breakout attempt.
- Ideal Entry Range: 41.92 to 40.99
- Exit Target (Target Price): 43.29, then 45.15
- Stop Loss protection: below 40.99
For non-traders, this means the chart is constructive, but it is still waiting for proof that the latest push can hold rather than fade, with the next check coming from how price behaves around 43.29 and the broader 45.15 high.
Summary Data UOB
| Last price | 43.29 SGD |
| Change 1 day / 5 days / 1 month | 1.69% / 2.83% / 4.16% |
| Trend / MA-cross | sideways / none |
| SMA20 / SMA50 | 41.92 / 42.08 |
| RSI (14) / Stochastic %K | 63.5 / 91.8 |
| Bollinger %B / ATR | 106% / 0.76 |
| Support / Resistance 20 days | 40.99 / 43.29 |
| Data as of | 28 September 2026 08:00 WIB |



