Singtel Stock Technicals Today: Drops 0.23%, Death Cross Pressure
On September 30, 2026: price 4.28 SGD, trend downtrend, RSI 35.2, support 4.25, resistance 4.56. technical analysis of singtel stock. Singtel Stock Technicals…

Singapore Telecom’s shares on SGX slipped to SGD 4.28 on 29 September 2026 at 08:00 WIB, easing 0.23% from the previous close and extending a one-month decline of 4.04%, according to Yahoo Finance data via the exchange. The stock is now trading below both its short- and medium-term trend lines, and that matters because it signals sellers still control the tape even after a relatively modest daily move. In plain terms, Singtel is not in a panic selloff, but it is still being pushed lower by a pattern of weaker highs and weaker closes.
Trend & Price Action
The chart shows the share price sitting below the SMA20 at 4.41 and below the SMA50 at 4.43, with the shorter average already crossing under the longer one in a death cross. That combination usually tells traders the recent downtrend has enough follow-through to matter; it is not just a one-day dip, but a market that has been losing altitude for several sessions. The SMA20 slope is also down 1.30% over 5 days, which reinforces that the short-term trend is still pointing lower rather than flattening out.
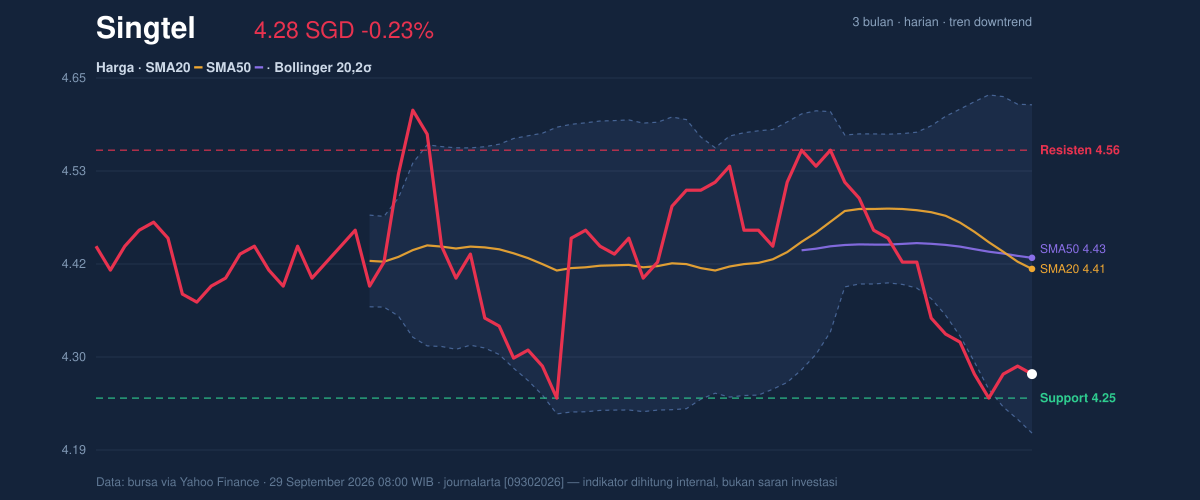
Price is also parked near the lower part of the recent range, sitting about 10% of the way up from the 20-hour support at 4.25 toward the 20-hour resistance at 4.56. That placement is important because it shows the stock is closer to the floor than the ceiling, but not yet at a level where buyers have clearly regained control. The broader three-month range gives the picture some context: the share price is below the 3-month high of 4.70 and just above the 3-month low of 4.19, so the market is testing the lower end of the recent trading band rather than breaking into new territory.
Oscillators & Momentum
Momentum indicators are mixed, but the balance still tilts negative. The RSI(14) at 35.2 is technically neutral, yet it is close to the oversold zone, which means selling pressure has been persistent enough to depress momentum without reaching an extreme that usually forces a rebound. More telling is the stochastic reading, with %K at 15.6 and %D at 16.3, both in oversold territory. That often indicates the stock is short-term stretched to the downside, but oversold does not automatically mean a bounce; it only means the market is vulnerable to one if sellers start to fade.
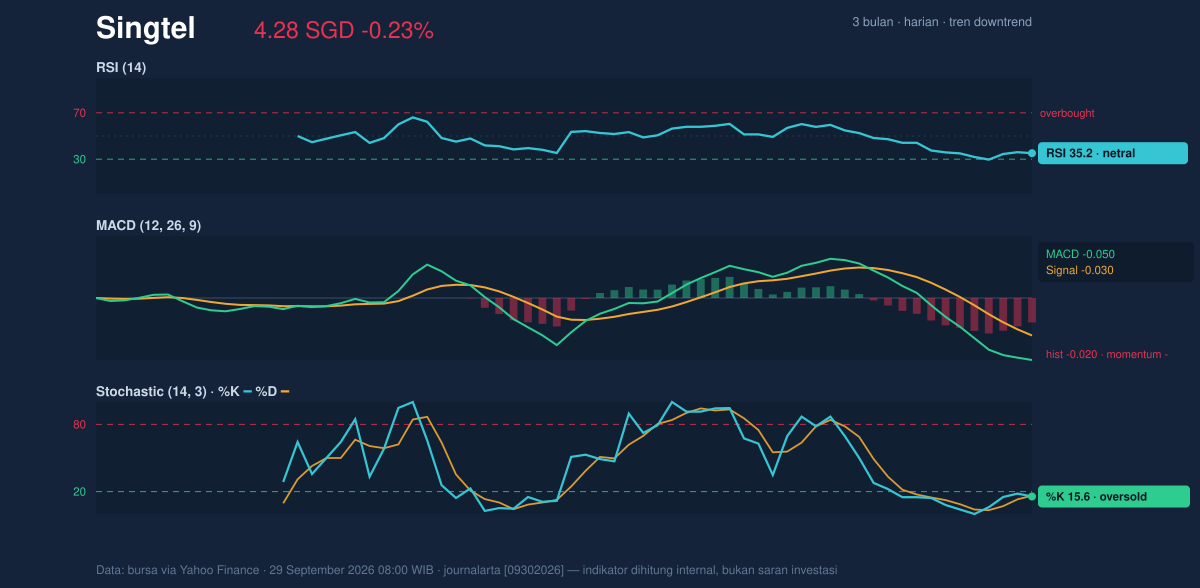
The MACD at -0.050, below its signal line at -0.030, and the histogram at -0.020 all point to momentum still running negative. In practical terms, MACD is telling us the recent price trend remains weaker than the longer trend, so there is no clean momentum reversal yet. This is why the stock can look oversold on stochastic while still failing to turn upward: the short-term stretch is there, but the trend engine has not switched off.
Volatility & Volume
The Bollinger Bands add another useful layer. With price near the lower band at 4.21, the %B reading of 18% shows Singtel is trading low in its recent distribution, a sign of weakness but also a location where mean-reversion traders usually start paying attention. The band width is 9.3%, described as normal, so this is not a volatility breakout setup; it is more of a controlled drift lower than an explosive move. That matters because a normal-width band often suggests the next move will still need a catalyst, rather than being driven by a sudden compression-release pattern.
ATR(14) at 0.06, or 1.5% of price, says the stock’s day-to-day movement is relatively calm. Low ATR usually means the market is not pricing in a sharp swing right now, which can make support and resistance levels more reliable in the near term. Volume last session was 21,825,400, about 1.1× the 20-hour average of 19,472,677, so participation was slightly above normal, but the OBV is falling. That combination is important: the market is trading a bit more actively, yet the cumulative volume trend still favours sellers, which suggests down days are carrying more conviction than up days.
Key Levels & Scenarios
The nearest technical floor is 4.25, and the next downside reference is the 3-month low at 4.19. If price fails to hold 4.25, the chart would shift from a mild downtrend into a more vulnerable test of the lower range boundary. On the upside, 4.41 and 4.43 are not just moving averages; they are the first hurdles where short-term sellers are likely to reappear. Above that, 4.56 is the immediate resistance that would need to be cleared before the chart could start repairing its structure.
The current setup is therefore less about a strong trend reversal and more about whether the stock can stabilize after sliding toward support. The oversold stochastic reading gives buyers a technical excuse to probe for a rebound, but the death cross, negative MACD, and falling OBV still argue that any recovery needs proof. In other words, the market is close to a decision point, but it has not chosen direction yet.
Technical Verdict: HOLD (wait & see)
HOLD (wait & see)
- Death cross and price below SMA20 at 4.41 and SMA50 at 4.43 keep the trend negative.
- MACD remains below signal, showing downside momentum is still active.
- Stochastic is oversold and price is near the lower Bollinger band at 4.21, which raises rebound potential but does not confirm one.
Verdict invalidated if price falls below 4.19.
- Ideal Entry Range: 4.21 to 4.25
- Exit Target: 4.41 to 4.43
- Stop Loss protection: below 4.19
For non-traders: the stock is weak, but it is close enough to support that the next move could be a bounce or another leg down, and the chart has not yet confirmed which one.
Summary Data Singtel
| Last price | 4.28 SGD |
| Change 1 day / 5 days / 1 month | -0.23% / -0.93% / -4.04% |
| Trend / MA-cross | downtrend / death |
| SMA20 / SMA50 | 4.41 / 4.43 |
| RSI (14) / Stochastic %K | 35.2 / 15.6 |
| Bollinger %B / ATR | 18% / 0.06 |
| Support / Resistance 20 days | 4.25 / 4.56 |
| Data as of | 29 September 2026 08:00 WIB |


