HSBC Stock Drops 5.38%, RSI Oversold In Focus
On Oktober 5, 2026: price 149.50 HKD, trend downtrend, RSI 28.8, support 149.50, resistance 167.60. technical analysis of hsbc stock. HSBC Stock Drops — full…

At 149.50 HKD, HSBC Holdings on the Hong Kong exchange is trading at the edge of its recent range after a sharp -5.38% one-day drop, and the chart now shows a market that is technically weak but also stretched to the downside. The stock sits below the SMA20 at 161.01 and below the SMA50 at 161.97, while the death cross — where the short-term average slips under the longer-term average — signals that recent price action has been losing ground faster than the broader trend can absorb. As shown in the chart, that matters because it usually means rallies face overhead resistance sooner, not later.
Trend & Price Action
The price structure is firmly negative. HSBC is in a downtrend, with the SMA20 slope at -0.80% over 5 days, which means the shorter trend line is still pointing lower rather than flattening out. That slope is important: it tells readers the weakness is not just a one-day event but part of a continuing slide in average prices. The stock is also trading below the middle Bollinger band at 161.01, showing it is beneath the market’s recent “fair value” zone. In practical terms, the market has already repriced HSBC lower, and the burden is now on buyers to prove the decline has stopped.
The range tells a similar story. HSBC is sitting at the 0% end of the 20-hour range, with support at 149.50 and resistance at 167.60. That positioning means the stock is pressing directly against the lower boundary of its short-term trading band rather than recovering within it. The 3-month range reinforces the point: the stock is close to the 3-month low of 147.00, not the 3-month high of 169.70. That is a sign of distribution, where selling pressure has been strong enough to push price back toward the lower end of the recent cycle.
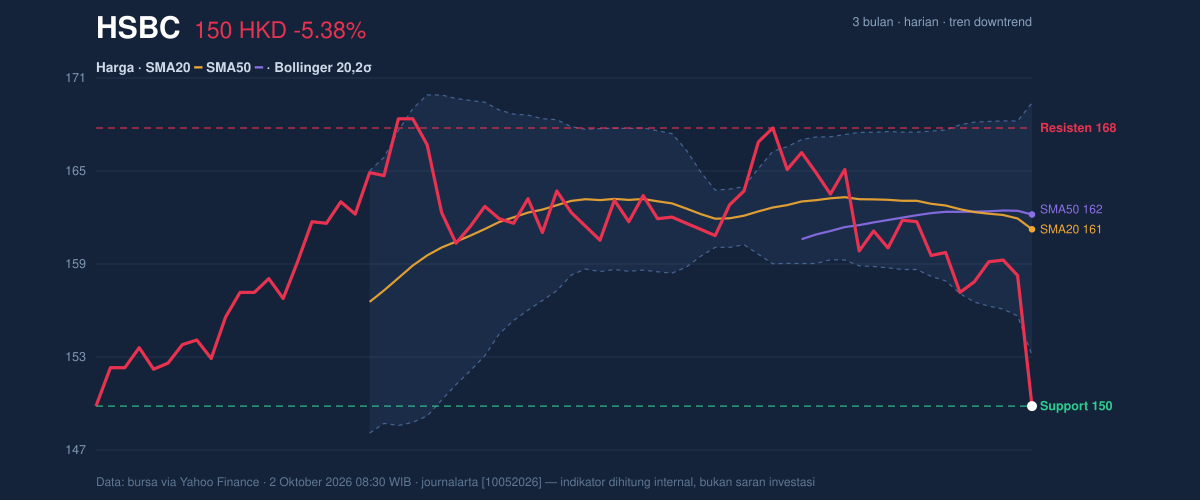
The Bollinger setup is also telling. With the lower band at 152.79 and price beneath it, HSBC is trading outside the usual volatility envelope on the downside. The %B at -20% indicates the stock is not just weak, but extended below the band that typically contains most price action. That often reflects panic-like selling or an overshoot that can attract short-term bargain hunting. Still, the broader message remains negative until price re-enters the band and holds there.
Oscillators & Momentum
Momentum indicators are oversold, but they are not yet confirming a reversal. The RSI at 28.8 sits just under the common oversold threshold of 30, which means the stock has been sold aggressively enough to enter a zone where rebounds can occur. However, oversold does not mean a bounce is guaranteed; it simply says the market may be stretched. The Stochastic %K at 4.3 and %D at 21.4 are even weaker, showing the latest price is near the bottom of its recent momentum band. When Stochastic is this low, it usually suggests sellers have dominated the short-term tape.
The problem is the MACD does not yet support a recovery. The MACD at -1.800 remains below the signal line at -0.833, and the histogram at -0.966 is still negative. In plain language, the trend momentum is still leaning downward, and the gap between MACD and signal confirms that the bearish impulse has not fully faded. As shown in the momentum chart, oversold oscillators are flashing, but the trend-following indicator is still pointing the other way.
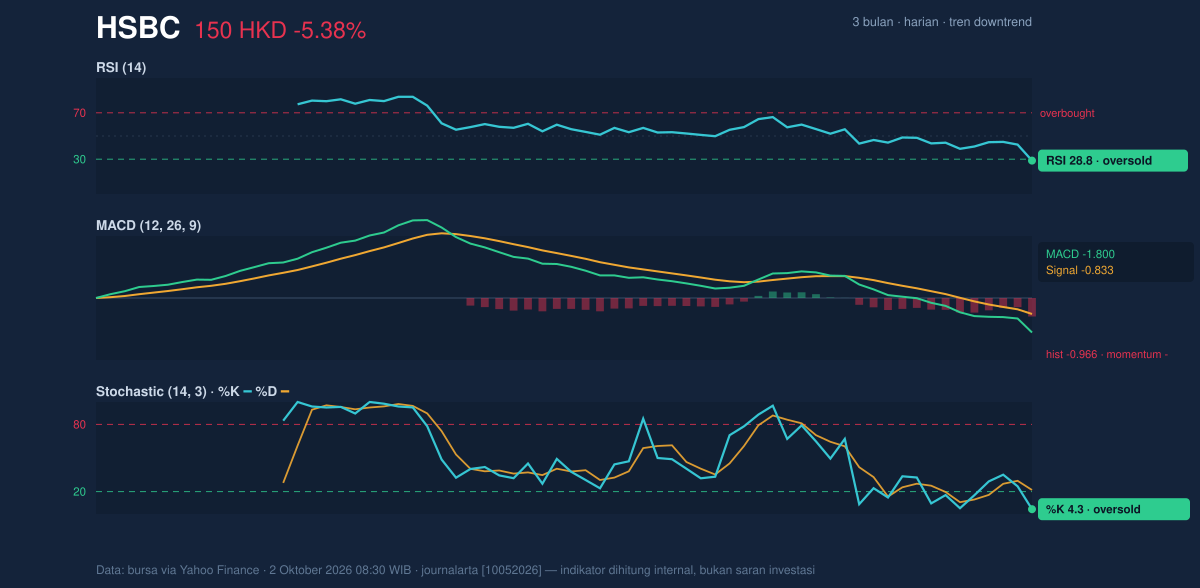
That combination matters. When RSI and Stochastic are oversold while MACD remains negative, the market often sits in a “washed-out” phase: downside pressure may be mature, but the first bounce can fail if trend momentum has not turned. The signal is less “reversal confirmed” and more “selling may be exhausted, but not yet reversed.”
Volatility & Volume
Volatility is active but not extreme. The ATR at 3.24, equal to 2.2% of price, suggests a normal-to-firm daily swing size for a large-cap bank stock. That means the stock can still move meaningfully in either direction, but the market is not in a full volatility shock. The Bollinger band width of 10.2% is described as normal, which implies the current selloff is happening within a standard volatility regime rather than a squeeze or explosion phase. In other words, the move is sharp, but not structurally chaotic.
Volume is more decisive. The latest session printed 24,964,374 shares versus a 20-hour average of 11,249,668, or about a 2.2× jump. That is important because heavy volume on a down day usually means the move had participation, not just thin trading. The fact that OBV is falling supports that interpretation: money flow has been leaving the stock, and the volume surge is confirming the selloff rather than contradicting it. A rebound would need to show the opposite — rising price on strong volume — before the tape can be called healthier.
Key Levels & Scenarios
The immediate technical battlefield is narrow. 149.50 HKD is the closest support and also the latest price, so the market is effectively testing whether this level can act as a floor. If it fails, the next reference from the data is the 3-month low at 147.00. On the upside, the first meaningful hurdle is the lower Bollinger band at 152.79, then the SMA20 at 161.01 and SMA50 at 161.97, with 167.60 acting as the short-term resistance ceiling.
If price can reclaim the lower Bollinger band and hold above it, that would suggest the oversold reading is starting to translate into stabilization. If it cannot, the chart remains vulnerable to another push toward the 3-month low. The key point is that the stock is not yet showing the kind of momentum shift needed to call the decline finished.
Technical Verdict: HOLD (wait & see)
HOLD (wait & see) — the stock is oversold, but the trend is still bearish and volume confirms selling pressure.
- Reason 1: Trend remains weak — price is below the SMA20 at 161.01 and SMA50 at 161.97, with a death cross still in place.
- Reason 2: Momentum is negative — RSI 28.8 and Stochastic 4.3/21.4 are oversold, but MACD -1.800 is still below the signal line.
- Reason 3: Volume confirms the move — the 2.2× volume surge and falling OBV show sellers remain active.
- Invalidation condition: this verdict is invalidated if price falls below 147.00.
- Ideal Entry Range: 149.50 to 152.79 HKD
- Exit Target (Target Price): 161.01 to 161.97 HKD
- Stop Loss protection: below 147.00 HKD
In plain English: HSBC is cheap enough to attract attention, but the chart has not yet proved that the selling has stopped.
Latest fact: the stock closed at 149.50 HKD, with 149.50 as support and 147.00 as the next downside reference.
Summary Data HSBC
| Last price | 149.50 HKD |
| Change 1 day / 5 days / 1 month | -5.38% / -4.72% / -8.56% |
| Trend / MA-cross | downtrend / death |
| SMA20 / SMA50 | 161.01 / 161.97 |
| RSI (14) / Stochastic %K | 28.8 / 4.3 |
| Bollinger %B / ATR | -20% / 3.24 |
| Support / Resistance 20 days | 149.50 / 167.60 |
| Data as of | 2 Oktober 2026 08:30 WIB |
Track HSBC share price daily: live levels, support/resistance and our full HSBC analysis history.


