RSI Oversold, AIA Stock Drops 5.98% Today
On Oktober 5, 2026: price 69.20 HKD, trend sideways, RSI 26.7, support 69.20, resistance 77.50. technical analysis of aia stock. RSI Oversold — full details…

69.20 HKD is where AIA Group’s latest slide has paused for now, but the market is still treating the move as a break lower rather than a routine pullback. On the Hong Kong exchange, the stock fell 5.98% in one day to 69.20 HKD, extending a 8.71% drop over five days and a 10.48% decline over one month. That matters because the price is now below both the SMA20 at 75.53 and the SMA50 at 75.44, a sign that short- and medium-term traders are no longer paying up for the shares. As shown in the chart, the stock has slipped to the bottom of its recent range, with 69.20 HKD sitting just above the 3-month low of 69.10 and well under the 20-hour resistance at 77.50.
Trend & Price Action
The structure is still described as sideways, but that label hides a more fragile setup. The SMA20 slope of -1.08% over five days shows the short-term trend is tilting downward, not flattening out. When price trades below both moving averages and those averages sit close together, as they do here, it usually signals a market that has lost direction on the upside and is now testing whether buyers can defend the lower edge of the range.
The lack of a new MA-cross is also telling. A fresh cross often marks a decisive shift in trend; its absence suggests the move is being driven more by selling pressure and momentum loss than by a clean technical reset. The stock is not far from the 3-month low of 69.10, which is important because markets often react sharply when a price revisits a prior floor. If that floor gives way, the chart would stop looking like a range and start looking like a breakdown.
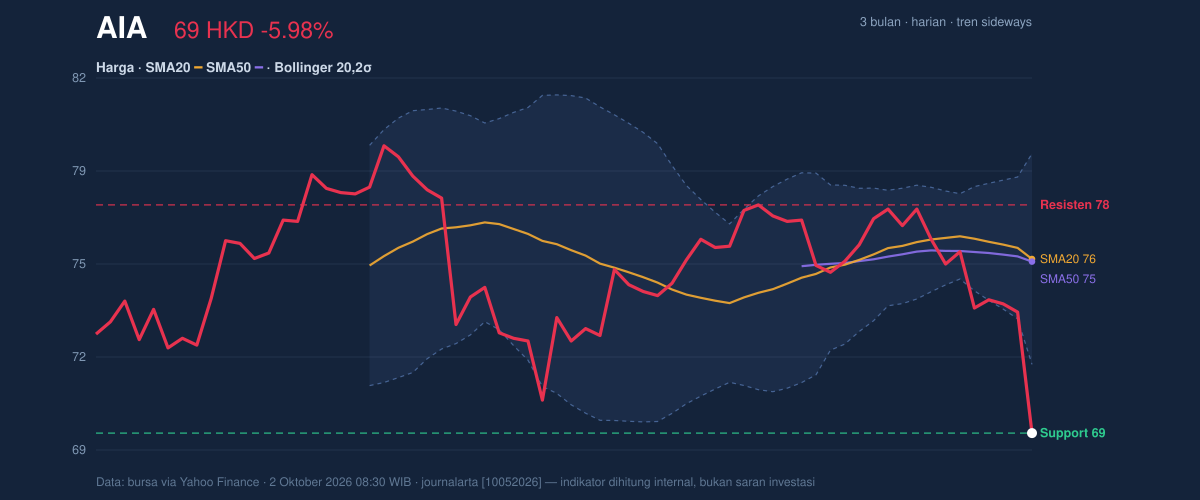
The Bollinger Band picture reinforces that message. Price is below the lower band at 71.70, and the reported %B of -33% shows the stock has moved outside the normal band envelope. In plain English, that means the shares are trading at a level that is statistically stretched to the downside. But stretched does not automatically mean safe. It can also mean the market is under pressure and needs fresh demand before it can stabilize.
Oscillators & Momentum
Momentum is weak, but it is also approaching exhaustion. The RSI at 26.7 is in oversold territory, while Stochastic %K at 1.1 and %D at 12.4 are even more compressed. Those readings say sellers have been in control for long enough that the stock is now technically washed out. That often precedes a bounce, but oversold conditions are not a timing signal on their own. They only matter if price action starts to improve.
The more cautionary reading comes from MACD. The MACD at -0.772 remains below the signal line at -0.113, and the histogram at -0.660 shows the bearish gap is still open. That means downside momentum is not yet fully spent. As shown in the momentum chart, the oscillators are oversold, but the trend-following signal still points lower, which is a classic mixed setup: pressure is intense, but a reversal has not been confirmed.
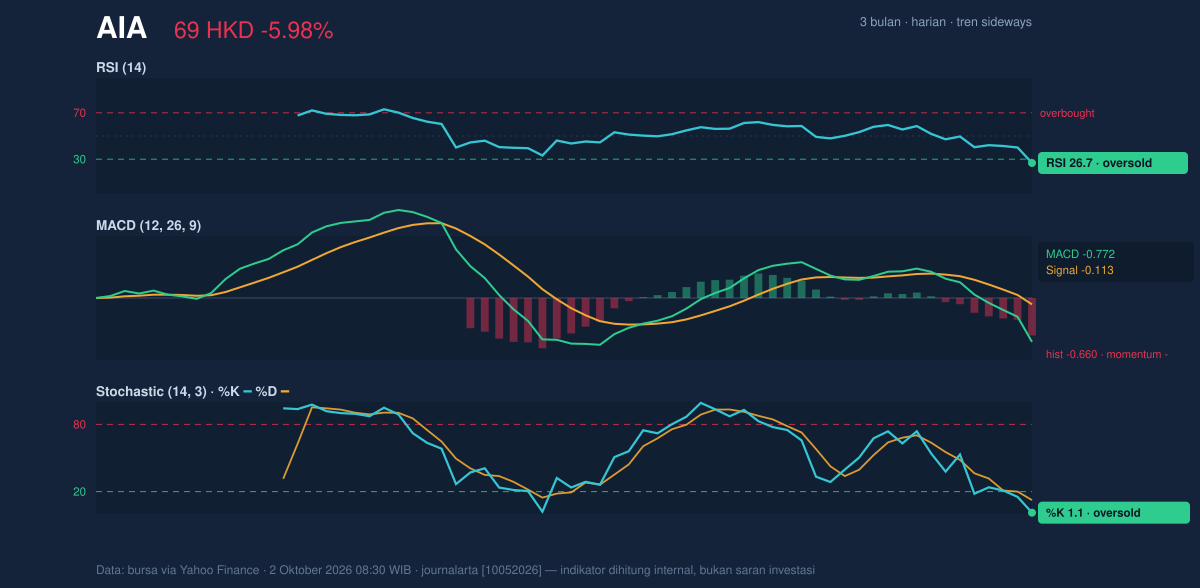
This is the key nuance for readers. Oversold RSI and Stochastic readings tell you the decline has become extended. Negative MACD tells you the decline is still active. When those two messages conflict, price usually needs confirmation from a reversal candle, a reclaim of a nearby average, or a volume-backed close back inside the Bollinger Band before the market can be said to have turned.
Volatility & Volume
Volatility is present, but not extreme. The ATR(14) at 1.96, equal to 2.8% of price, suggests the stock can still move with meaningful daily swings without entering panic conditions. The Bollinger Band width of 10.2% is described as normal, so this is not a squeeze waiting for a violent breakout. Instead, the current move looks like a directional selloff within an otherwise ordinary volatility regime.
Volume adds an important confirmation. The latest session printed 43,241,561 shares, about 1.6× the 20-session average of 27,359,083. That is not a quiet drift lower; it is a move with participation. The problem is that OBV is down, which means the heavier trading has been associated with net distribution rather than accumulation. In practical terms, more shares are changing hands, but the balance of that activity has favored sellers.
Key Levels & Scenarios
The market is now pinned between a nearby floor and a much higher ceiling. The immediate support at 69.20 is effectively being tested now, while 69.10 is the key nearby low from the 3-month range. On the upside, the first meaningful resistance is 71.70 at the lower Bollinger Band, followed by the SMA20 at 75.53 and the 20-hour resistance at 77.50. The chart shows price sitting at the very bottom of the recent range, so any rebound would first need to reclaim the band area before it can challenge the moving averages.
If 69.10 fails, the technical message would worsen quickly because the stock would be setting a fresh 3-month low. If price can instead recover above 71.70, that would be the first sign that the oversold condition is turning into stabilization rather than further downside. A return above 75.53 would matter even more, because that would place the stock back inside the moving-average zone and reduce the immediate bearish pressure.
Technical Verdict: HOLD (wait & see)
HOLD (wait & see) is the clearest technical verdict because the stock is oversold, but the trend and momentum are still negative.
- RSI at 26.7 and Stochastic %K at 1.1 show the shares are technically stretched to the downside.
- MACD at -0.772 with a negative histogram of -0.660 says bearish momentum has not yet turned.
- Price remains below the SMA20 at 75.53, below the SMA50 at 75.44, and below the lower Bollinger Band at 71.70, so the trend has not reasserted itself.
Verdict invalidated if price breaks below 69.10.
- Ideal Entry Range: 69.10 to 71.70
- Exit Target: 75.44 to 75.53
- Stop Loss protection: below 69.10
In plain English, the stock looks heavily sold, but it has not yet shown that the selling is over.
Summary Data AIA
| Last price | 69.20 HKD |
| Change 1 day / 5 days / 1 month | -5.98% / -8.71% / -10.48% |
| Trend / MA-cross | sideways / none |
| SMA20 / SMA50 | 75.53 / 75.44 |
| RSI (14) / Stochastic %K | 26.7 / 1.1 |
| Bollinger %B / ATR | -33% / 1.96 |
| Support / Resistance 20 days | 69.20 / 77.50 |
| Data as of | 2 Oktober 2026 08:30 WIB |
Track AIA share price daily: live levels, support/resistance and our full AIA analysis history.


