Tencent Stock Drops 2.27% Today, Testing Support Level
On Oktober 5, 2026: price 421.20 HKD, trend downtrend, RSI 41.0, support 419.00, resistance 451.60. technical analysis of tencent stock.

Tencent Holdings slid on HKEX in Hong Kong on Thursday, with 0700.HK last changing hands at HKD 421.20, down from a previous close of HKD 431.00, as the stock extended a short-term pullback and moved back toward the lower end of its recent trading range. The chart shows a market that is not collapsing, but is clearly under pressure: price is below the short- and medium-term moving averages, momentum is weak, and volume is not yet showing the kind of surge that usually marks a decisive reversal.
Trend & Price Action
Tencent is still in a downtrend, and the signal is coming from both price structure and trend slope. The stock is sitting below the SMA20 at HKD 433.70 and also below the SMA50 at HKD 447.51, which means recent trading has lost the support of both the faster and slower trend lines. The SMA20 slope of -0.69% over 5 days reinforces that the short-term direction is still easing lower rather than stabilizing. There is no fresh MA cross, so the chart does not yet show the kind of moving-average turn that would suggest a trend reset.
The location matters as much as the direction. Tencent’s HKD 421.20 last price is only slightly above the 20-hour support at HKD 419.00 and well below the 20-hour resistance at HKD 451.60. That places the stock near the bottom of its recent range, with the chart showing price at roughly 7% of the range from support to resistance. In practical terms, that means the market is trading close to where buyers have recently appeared, but not yet proving that they can absorb supply.
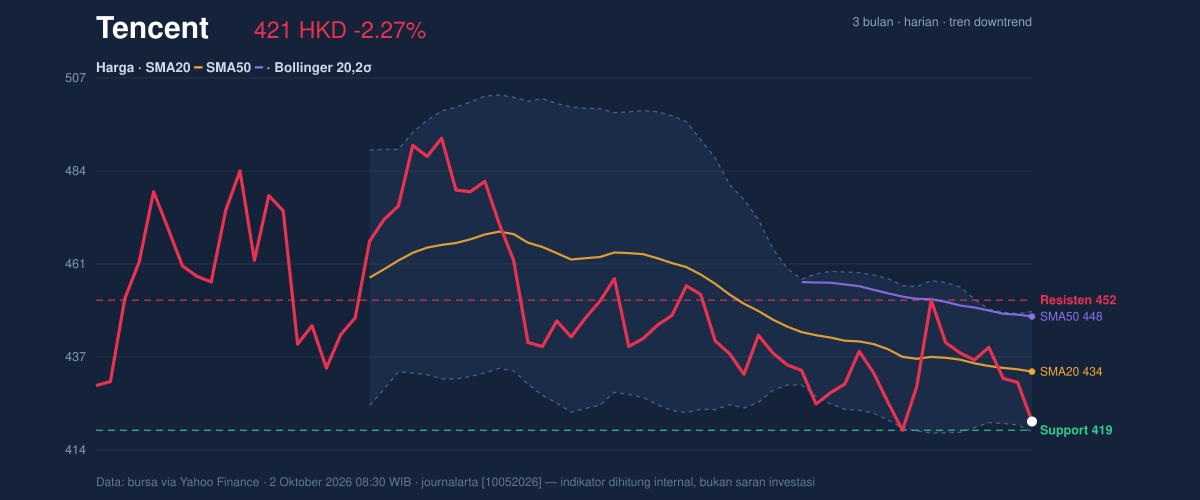
The 3-month range adds context: Tencent is trading far below the 3-month high of HKD 497.80 and only just above the 3-month low of HKD 419.00. That proximity to the low is important because it tells readers the stock is no longer in a broad upward phase; it is testing whether the recent floor can hold.
A floor is being tested, not a ceiling.
Oscillators & Momentum
Momentum indicators are mixed, and that mix is exactly what makes the current setup interesting. The RSI(14) at 41.0 is neutral, which means the stock is not yet oversold in a classic sense, but it is drifting into the weaker half of the range. More telling is the Stochastic %K at 5.0 and %D at 20.4, which points to an oversold condition. Stochastic is a faster gauge of recent price position, so readings this low often mean the stock has been sold hard in the short term. That does not guarantee a rebound, but it does show the selling may be stretched.
The MACD at -3.920, below the signal line at -3.844, with a histogram of -0.077, still argues that downside momentum remains in control. In plain language, MACD is showing that recent price action is still weaker than the trend it is being compared with. The histogram is only slightly negative, which suggests the bearish momentum is not accelerating sharply, but it has not turned positive either.
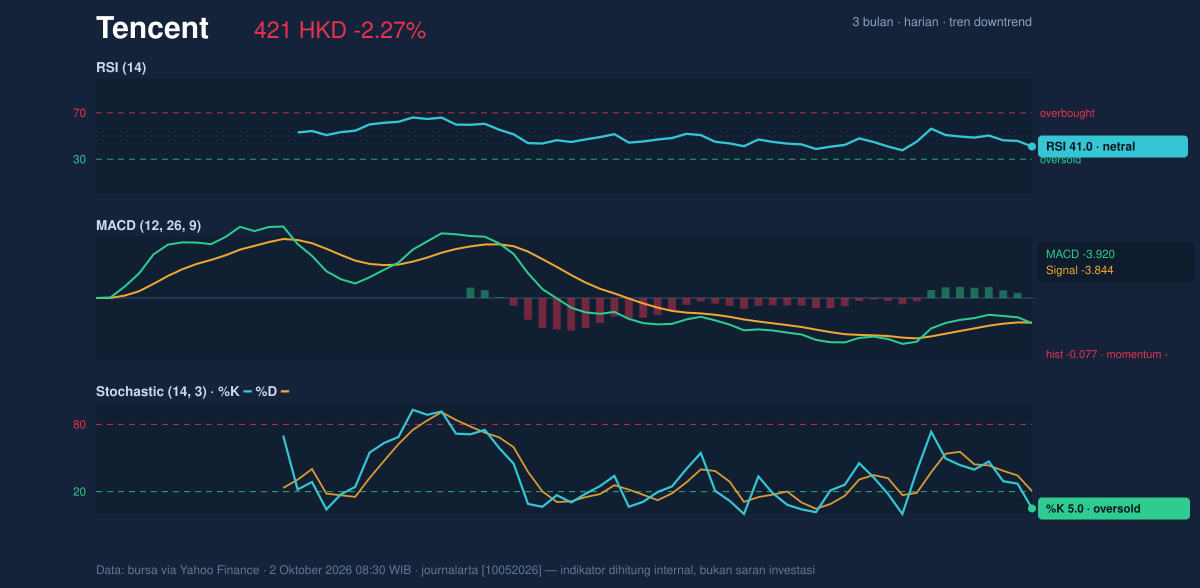
So the message from the oscillators is not “strong recovery,” but rather “sold down enough to watch carefully.” The stock is oversold on one fast measure, neutral on another, and still negative on the trend-following measure. That combination often precedes a pause, but not necessarily a reversal.
Volatility & Volume
Bollinger Bands give the clearest clue about the next phase. Tencent is trading near the lower band, with %B at 9% and the lower band at HKD 418.64. %B at 9% means price is sitting very close to the bottom of the band structure, a position that often reflects short-term exhaustion. At the same time, the band width of 6.9% is relatively tight and described as a squeeze, which matters because squeezes can precede sharper moves once price escapes the range. In other words, the market is compressed now, and compressed markets tend not to stay quiet for long.
The ATR(14) at 12.36, or 2.9% of price, shows volatility is moderate rather than extreme. That means the stock still has room to move, but not in a chaotic way. Volume is not confirming a strong turn yet: the latest 19,108,045 shares traded is below the 20-hour average of 20,124,965, and OBV is falling. OBV, or on-balance volume, tracks whether volume is flowing in the direction of price. A declining OBV suggests sellers have had the stronger hand during the latest moves.
That is the key tension in the chart: price is stretched near support, but participation has not yet flipped in favor of buyers.
Key Levels & Scenarios
The market is now focused on a narrow set of levels. HKD 419.00 is the first line to watch because it is both 20-hour support and the 3-month low. If price can hold above that zone and reclaim the lower Bollinger band at HKD 418.64 without slipping further, it would suggest the recent selling pressure is being absorbed. If that fails, the chart opens the door to a deeper test, because there is little technical cushion immediately below the current area.
On the upside, HKD 433.70 marks the SMA20 and the Bollinger middle band, which is the first meaningful recovery checkpoint. Above that, HKD 447.51 at the SMA50 becomes the next major barrier, followed by HKD 451.60 at resistance. A move back through those levels would tell the market that the recent decline is losing force and that the stock is rebuilding trend structure.
Technical Verdict: HOLD (wait & see)
HOLD (wait & see)
- Reason 1: Price is still below the SMA20 and SMA50, and the SMA20 slope is negative, so the trend has not turned.
- Reason 2: Stochastic is oversold, but MACD remains negative; that is a mixed signal, not a confirmed reversal.
- Reason 3: Bollinger Bands are squeezing and price is near the lower band, which raises the odds of a sharp move but does not define the direction yet.
- Verdict invalidated if price breaks below HKD 419.00, because that would mean support and the 3-month low have failed together.
- Ideal Entry Range: HKD 419.00 to HKD 433.70
- Exit Target: HKD 447.51 to HKD 451.60
- Stop Loss protection: Below HKD 419.00
For non-traders, this means Tencent is close to an important floor, but the chart has not yet shown enough strength to prove the slide is over.
“It’s sitting on the edge of support — and the next move will matter more than the last one.”
Summary Data Tencent
| Last price | 421.20 HKD |
| Change 1 day / 5 days / 1 month | -2.27% / -3.92% / -2.73% |
| Trend / MA-cross | downtrend / none |
| SMA20 / SMA50 | 433.70 / 447.51 |
| RSI (14) / Stochastic %K | 41.0 / 5.0 |
| Bollinger %B / ATR | 9% / 12.36 |
| Support / Resistance 20 days | 419.00 / 451.60 |
| Data as of | 2 Oktober 2026 08:30 WIB |
Track Tencent share price daily: live levels, support/resistance and our full Tencent analysis history.


