CSCO Stock Analysis: Gains 4.54%, Testing Key Resistance
On October 6, 2026: price 117.94 USD, trend sideways, RSI 68.1, support 106.43, resistance 117.94. technical analysis of csco stock. CSCO Stock Analysis — full…
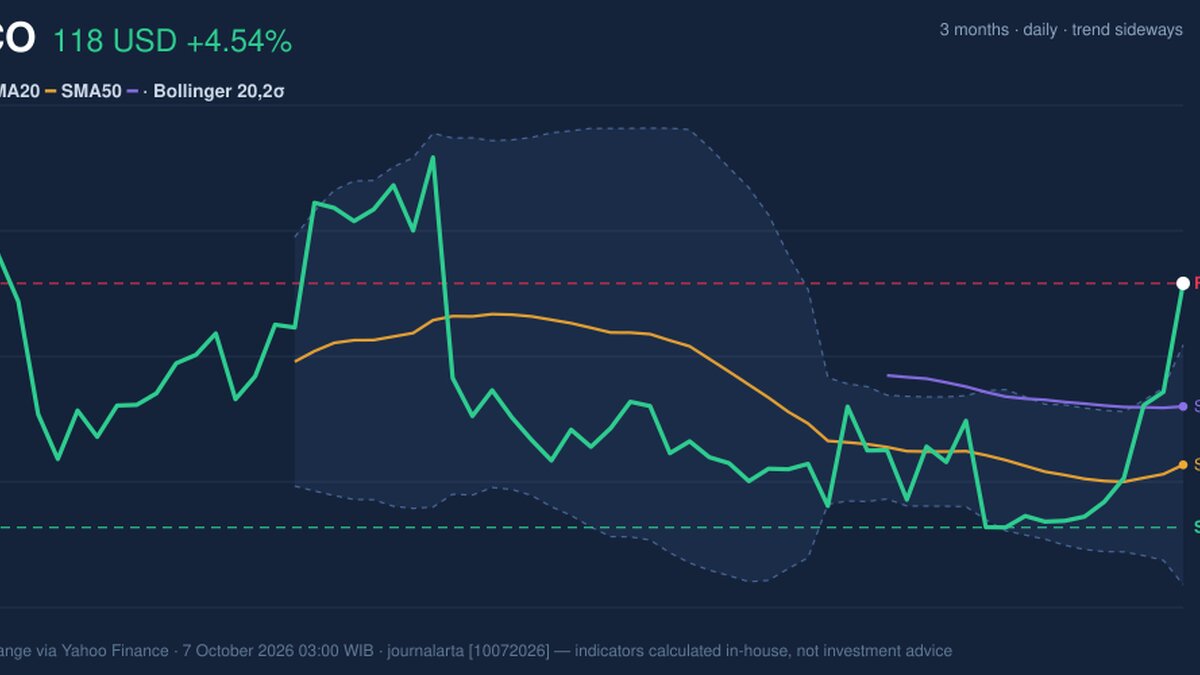
Cisco shares rose 4.54% to $117.94 on October 7, according to market data from Yahoo Finance, putting the networking company’s stock at the top of its recent trading range after gains of 10.29% over five days. The move came with trading volume about 1.1 times its 20-day average, while the On-Balance Volume indicator was rising—a sign that participation broadly supported the advance, rather than the price move occurring on unusually light trading.
Trend & Price Action
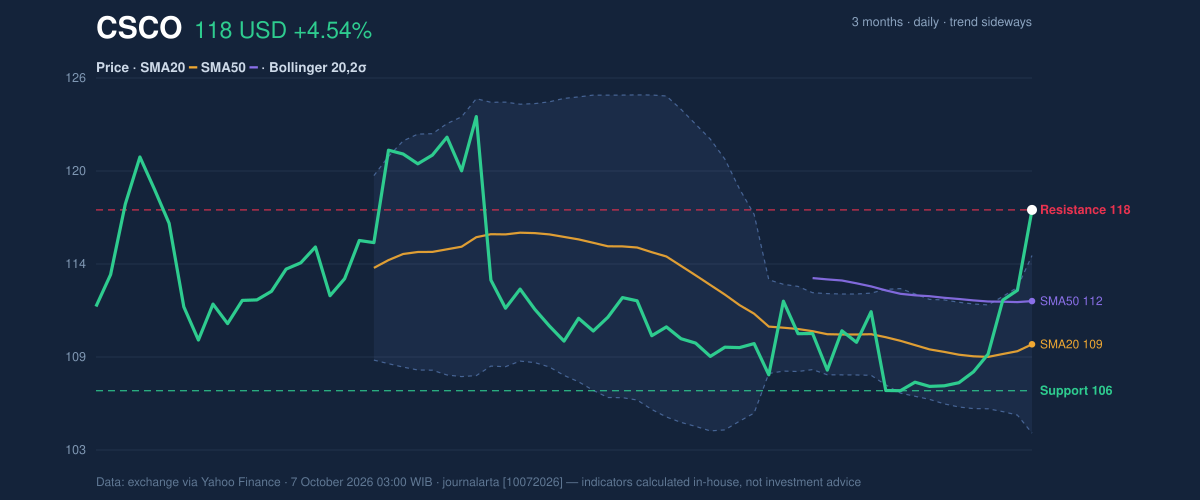
The short-term picture has strengthened, but the broader trend remains classified as sideways. Cisco trades above its 20-day simple moving average (SMA), at $109.38, and its 50-day SMA, at $112.14. An SMA averages prices over a set period to show the underlying direction; the stock’s position above both suggests buyers have the near-term advantage. However, there has been no new crossover between the averages, so the data does not confirm a fresh longer-term trend shift.
The gap between the current price and the 20-day average has also carried the stock above its Bollinger upper band, at $115.04. Bollinger bands measure how far a price has moved from its recent average; a reading above the upper band can reflect strong momentum, but it can also signal that the move has stretched beyond its normal recent range. The %B reading of 126% confirms the price is outside that band, while the band width of 10.3% remains normal rather than indicating a pronounced volatility squeeze or expansion.
As shown in the chart, the price has reached the 20-day resistance level of $117.94, placing it at 100% of the stated 20-day range. The three-month high of $124.71 is the next broader reference point, while the three-month low stands at $104.51.
Oscillators & Momentum
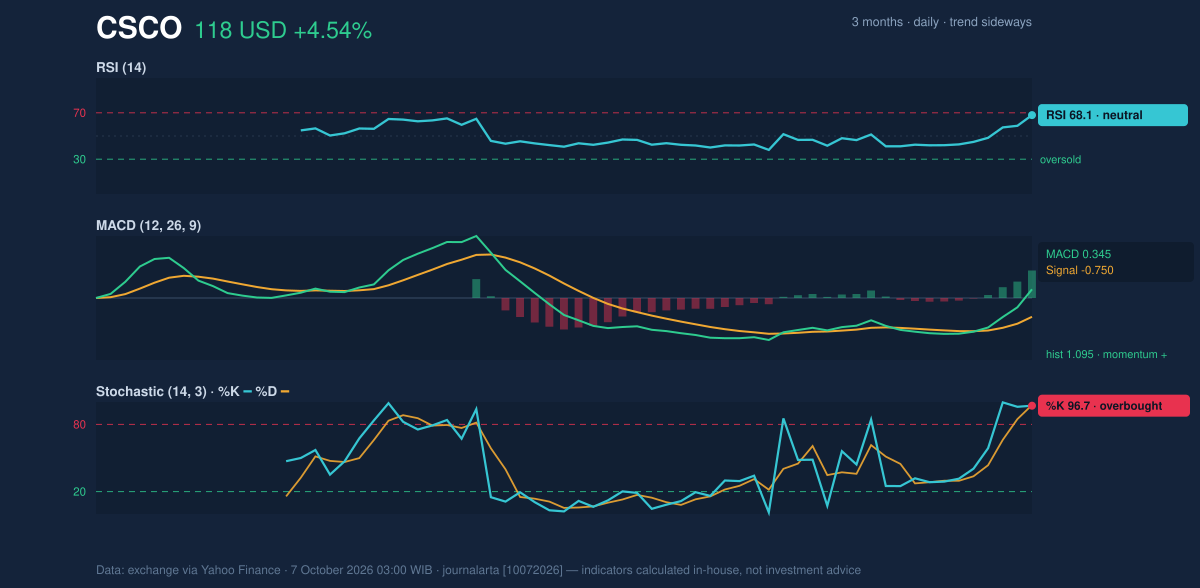
Momentum indicators are positive, though they point to different degrees of near-term heat. MACD, a measure comparing shorter- and longer-term price momentum, is at 0.345 against a signal line of -0.750, with a positive histogram of 1.095. That configuration indicates strengthening upward momentum. MACD is positive and accelerating, reinforcing the recent price rise rather than contradicting it.
The RSI, which gauges the speed and size of recent price moves, is 68.1 and is classified as neutral in the supplied data. It is elevated, but it has not crossed into an overbought reading under that classification. Stochastic, which compares the latest close with its recent price range, is more stretched: %K is 96.7 and %D is 97.3. Stochastic is overbought, meaning the stock has been closing near the upper end of its recent range; that can accompany a strong rally but also leaves room for a pause or pullback.
The chart helps distinguish those signals: MACD confirms positive momentum, while Stochastic warns that the advance may be crowded in the short term. RSI remains neutral at 68.1, so it does not yet provide the same overbought warning.
Volatility, Volume & Levels
Average True Range (ATR), a measure of typical daily price movement, is $2.77, or 2.3% of the share price. That indicates moderate volatility: a move of a few dollars would fit the recent movement profile, but the measure does not predict direction. Volume of 21,021,600 shares exceeded the 20-day average of 19,000,115, and rising OBV—an indicator that accumulates volume on rising sessions and subtracts it on falling ones—adds evidence that demand has accompanied the advance.
The immediate test is whether the stock can sustain a move beyond $117.94, its stated 20-day resistance. A failure to hold above that level could bring the 50-day SMA at $112.14 into focus, followed by the 20-day SMA at $109.38. The 20-day support is $106.43. Those levels offer reference points, not guarantees: the price is already above the Bollinger upper band, and the elevated Stochastic reading raises the possibility that momentum could cool before a sustained breakout.
Technical Verdict: BUY
The indicator balance supports a bullish technical verdict, while the stretched short-term reading argues for caution. Price is above both the 20-day and 50-day averages, MACD momentum is positive, and rising OBV with above-average volume confirms participation. The main counter-signal is overbought Stochastic, alongside a price above the upper Bollinger band.
- Ideal entry range: $112.14–$115.04, using the 50-day SMA and upper Bollinger band as reference levels.
- Exit target: $124.71, the three-month high.
- Stop-loss protection: $109.38, the 20-day SMA.
- Invalidation: The verdict is invalidated if price falls below $106.43, the 20-day support level.
In plain English, the indicators favor further strength, but the stock’s short-term momentum is hot enough that a pullback remains possible.
| Indicator | Latest reading |
|---|---:|
| Last price | $117.94 |
| SMA20 / SMA50 | $109.38 / $112.14 |
| Bollinger upper / middle / lower | $115.04 / $109.38 / $103.73 |
| RSI / Stochastic %K–%D | 68.1 / 96.7–97.3 |
| MACD / signal / histogram | 0.345 / -0.750 / 1.095 |
| ATR / volume vs. 20-day average | $2.77 / 1.1× |
| 20-day support / resistance | $106.43 / $117.94 |
| Three-month high / low | $124.71 / $104.51 |
Summary Data CSCO
| Last price | 117.94 USD |
| Change 1 day / 5 days / 1 month | 4.54% / 10.29% / 8.03% |
| Trend / MA-cross | sideways / none |
| SMA20 / SMA50 | 109.38 / 112.14 |
| RSI (14) / Stochastic %K | 68.1 / 96.7 |
| Bollinger %B / ATR | 126% / 2.77 |
| Support / Resistance 20 days | 106.43 / 117.94 |
| Data as of | 7 October 2026 03:00 WIB |
Track CSCO stock price daily: live levels, support/resistance and our full CSCO analysis history.