ORCL Death Cross Pressure: Stock Gains 1.61% (October 6, 2026)
On October 6, 2026: price 144.77 USD, trend sideways, RSI 51.1, support 132.60, resistance 161.63. technical analysis of orcl stock. ORCL Death Cross Pressure…
By Elena Vance
October 7, 20264 min read
ORCL Death Cross Pressure
Oracle’s shares rose 1.61% to $144.77 on the latest session, but the gain comes against a 10.92% decline over the past month. For international investors, the tension is clear: a short-term rebound has not yet overturned a broader, sideways price structure with weakening trend signals.
Trend & Price Action
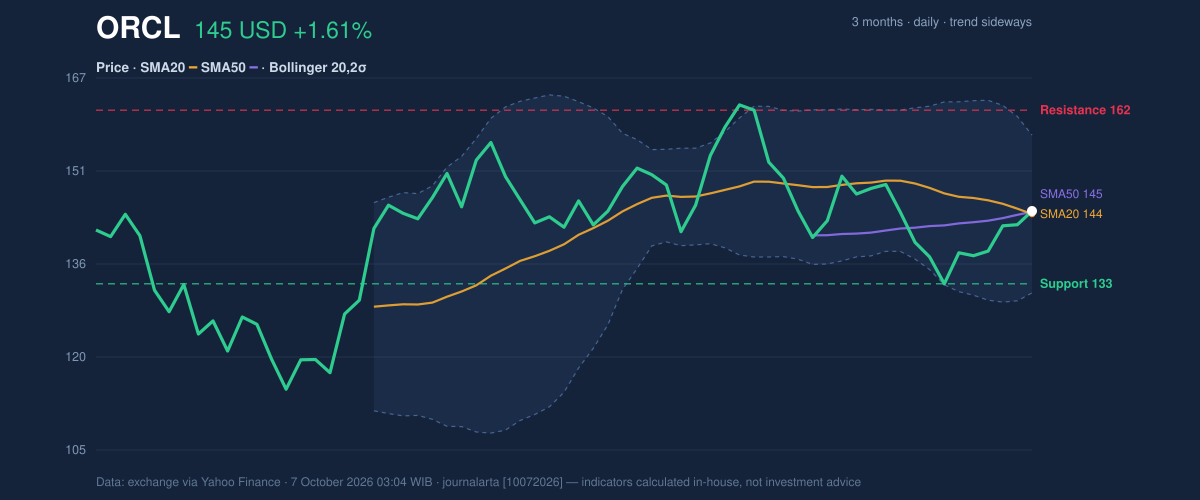
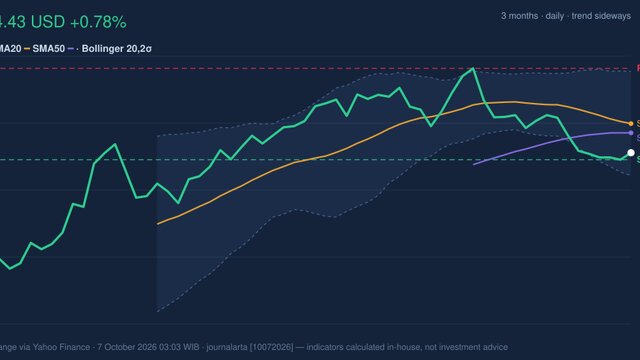
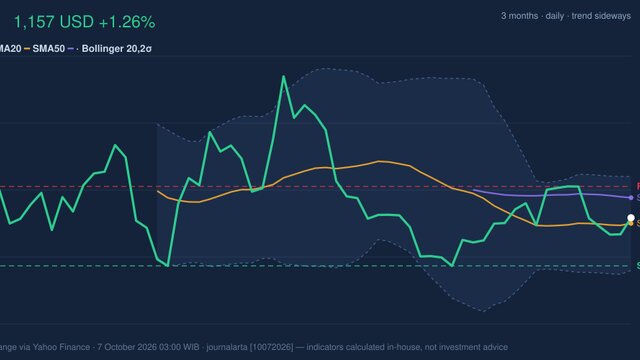
The stock is slightly above its 20-day moving average of $144.28 and its 50-day average of $144.64, placing it near a key test of direction. Yet the 20-day average has fallen 1.95% over five trading days, and a death cross—the 20-day average moving below the 50-day average—signals that recent price weakness has overtaken the medium-term trend. The averages are close enough that the latest rise puts Oracle near, rather than clearly beyond, that pressure.
At 42% of its 20-day range, the shares sit below the midpoint between support at $132.60 and resistance at $161.63. The three-month range, from $114.50 to $170.70, shows that the stock has recovered from its low but remains well below its high. The current position is therefore consistent with consolidation, not a confirmed return to the previous peak.
3-month price action chart of ORCL: price, SMA20/50, Bollinger, support & resistance. Data: exchange via Yahoo Finance.
Oscillators & Momentum
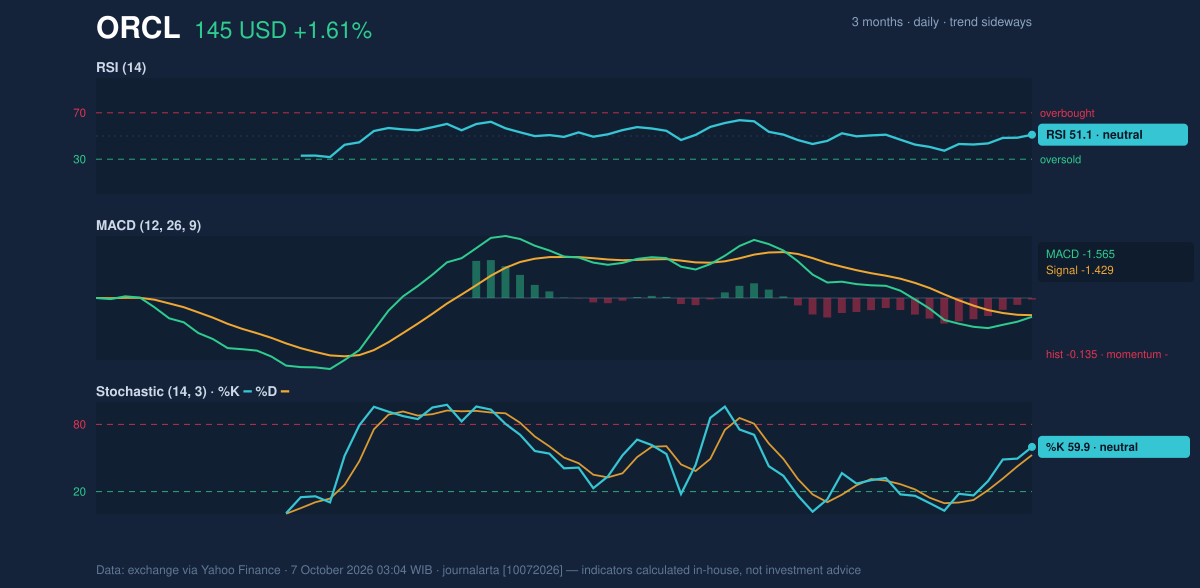
Momentum indicators offer little confirmation of a sustained advance. The RSI is neutral at 51.1, meaning recent gains and losses are broadly balanced rather than showing an extreme condition. The Stochastic readings are also neutral, with %K at 59.9 and %D at 52.7; they point to a modest improvement in short-term momentum, but not a decisive breakout signal.
MACD remains the main caution: its value of -1.565 is below its signal line at -1.429, and its histogram is negative at -0.135. That configuration indicates downside momentum is still present, even as the shares have risen over the past five sessions. In plain terms, price has bounced, but the momentum measure has not yet confirmed a reversal.
Momentum chart of ORCL: RSI(14), MACD, Stochastic. Data: exchange via Yahoo Finance.
Volatility & Volume
Oracle’s Bollinger bands—the range around a moving average that helps show whether prices are unusually stretched—are at normal width, not compressed into a narrow squeeze or sharply expanding. The share price is near the middle band at $144.28, while the band extends from $131.09 to $157.47. Its 52% position within the bands is close to the midpoint, reinforcing the picture of a market without a strong directional signal.
Volatility remains meaningful: the average true range is $6.08, or 4.2% of the share price. That measure captures typical daily price movement, so swings can be large even when the broader trend is flat. Participation, however, has been light. Latest volume of 19,996,700 shares was about 0.6 times the 20-day average of 34,978,055, while on-balance volume (OBV), a running measure of buying versus selling volume, is falling. The rebound is therefore not backed by strong volume confirmation.
Key Levels & Scenarios
The first test is whether Oracle can hold around its moving averages and build on the recent five-day gain. A sustained move through the upper Bollinger band at $157.47 would put the 20-day resistance at $161.63 in focus. That would suggest buyers are overcoming the recent sideways structure, though the falling OBV and negative MACD remain hurdles.
If the stock fails to hold near its moving averages, support at $132.60 becomes the more important reference. A break below that level would weaken the current consolidation case and expose the lower Bollinger band at $131.09. These are conditional technical signals, not forecasts: thin volume makes the latest move less persuasive, while the elevated ATR means levels can be tested quickly.
Technical Verdict: HOLD (wait & see)
The indicators support a neutral stance rather than a clear directional verdict. Oracle is just above its moving averages, but the death cross, negative MACD and falling OBV offset the recent price gains. RSI and Stochastic remain neutral, while the stock sits near the center of its Bollinger bands.
- Ideal entry range: $144.28–$144.64, around the 20-day and 50-day moving averages; this is a technical reference area, not a recommendation.
- Exit target: $157.47–$161.63, spanning the upper Bollinger band and 20-day resistance.
- Stop-loss protection: $131.09–$132.60, around the lower Bollinger band and 20-day support.
- Invalidation: The neutral verdict is invalidated if price falls below $132.60.
For non-traders, the signals are mixed: Oracle has rebounded, but the evidence does not yet show that the broader trend has turned upward.
Indicator
Reading
Last price
$144.77
Daily change
+1.61%
One-month change
-10.92%
SMA20 / SMA50
$144.28 / $144.64
20-day support / resistance
$132.60 / $161.63
RSI(14)
51.1, neutral
MACD / signal / histogram
-1.565 / -1.429 / -0.135
ATR(14)
$6.08 (4.2%)
Volume / 20-day average
19,996,700 / 34,978,055
Source: Exchange data via Yahoo Finance, as of October 7, 2026, 03:04 WIB. Technical analysis is not investment advice.