T Testing Support Level: Stock Gains 0.78% (October 6, 2026)
On October 6, 2026: price 24.43 USD, trend sideways, RSI 41.4, support 24.24, resistance 26.72. technical analysis of t stock. Testing Support Level — full…
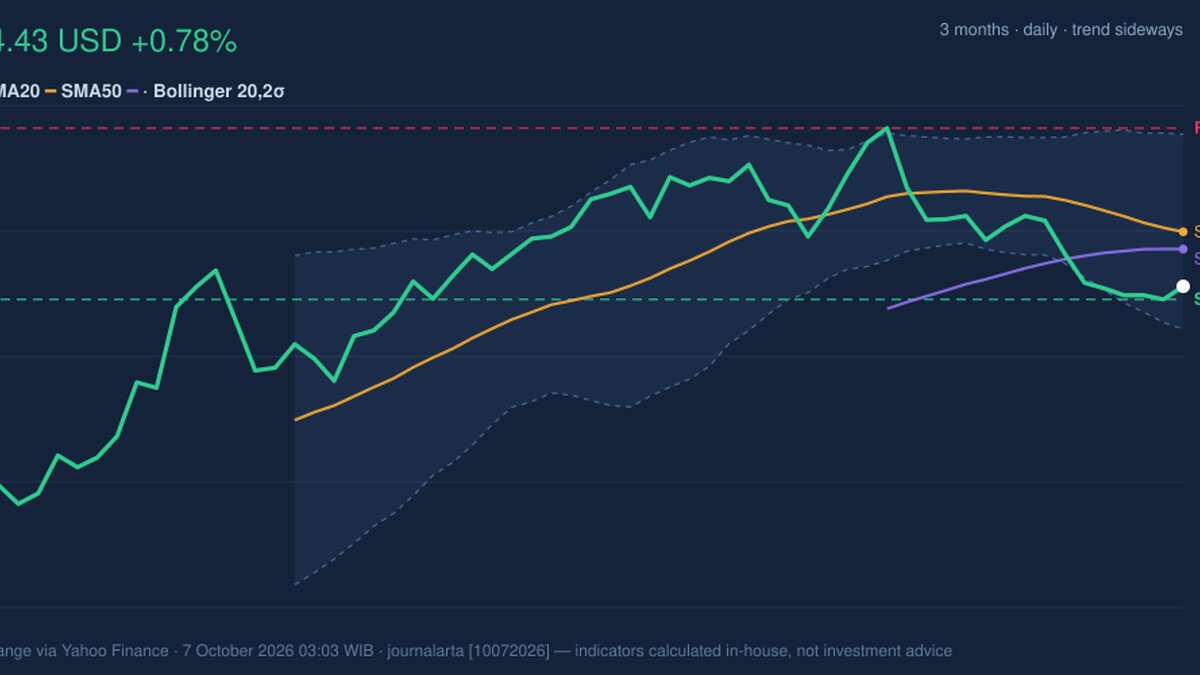
AT&T shares rose 0.78% to $24.43 on Oct. 7, but the daily gain has not yet changed the stock’s broader technical picture. The shares remain below both key moving averages, while negative MACD momentum and falling on-balance volume suggest the recent advance lacks strong confirmation. The data, supplied via Yahoo Finance from exchange trading, show a market moving sideways rather than establishing a clear recovery.
Trend & Price Action
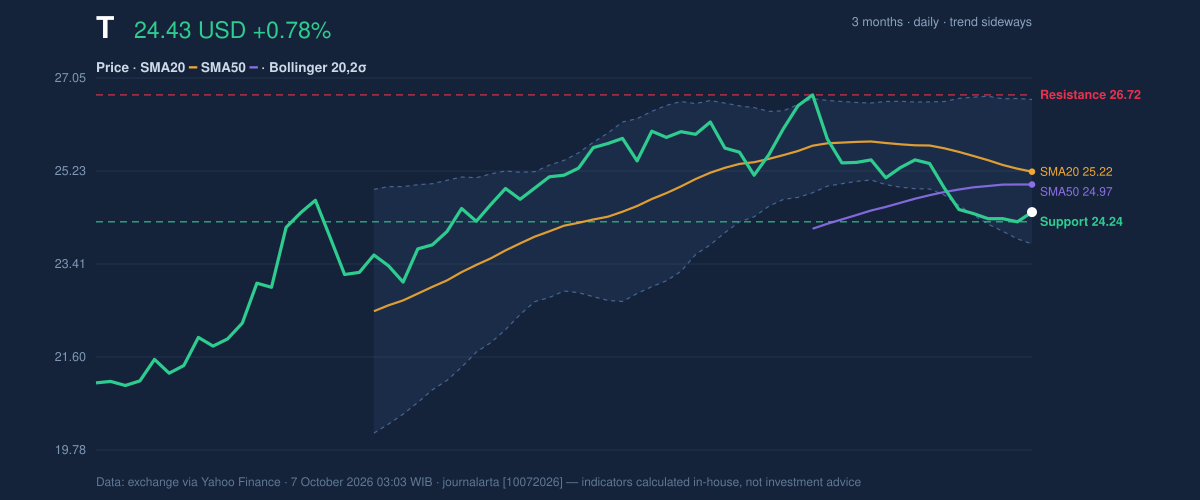
AT&T is trading below its 20-day SMA of $25.22 and 50-day SMA of $24.97. A simple moving average tracks the average price over a set period; trading below both indicates that recent prices have not reclaimed those reference levels. The 20-day average is also sloping downward, by 1.51% over five days, reinforcing the near-term weakness. There has been no new moving-average crossover to signal a decisive shift in trend.
The stock’s $24.43 price sits near the lower end of its recent range: the supplied data place it 8% of the way through the range between $24.24 support and $26.72 resistance. That proximity makes the lower boundary important. A hold there would preserve the current range; a break below it would weaken the chart further. Over the past three months, AT&T has traded between $20.62 and $26.93, putting the current price well above the period low but still short of the high.
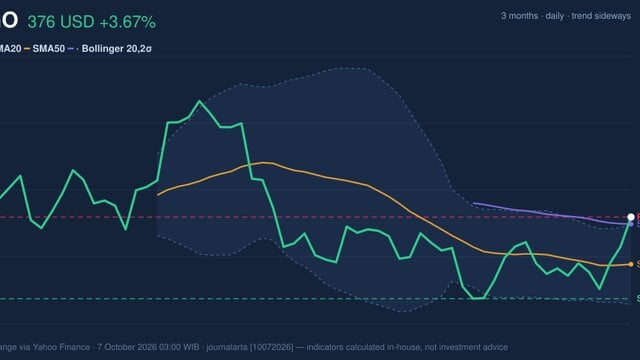
As shown in the chart, the Bollinger Bands span $23.81 to $26.63, with a midpoint of $25.22. These bands map recent price variation around an average; the current 22% position within them places the shares in the lower portion of the band, consistent with pressure on the price rather than an established upswing. The band width is 11.2%, classified as normal, so the data do not point to an unusually compressed setup or a volatility surge.
Oscillators & Momentum
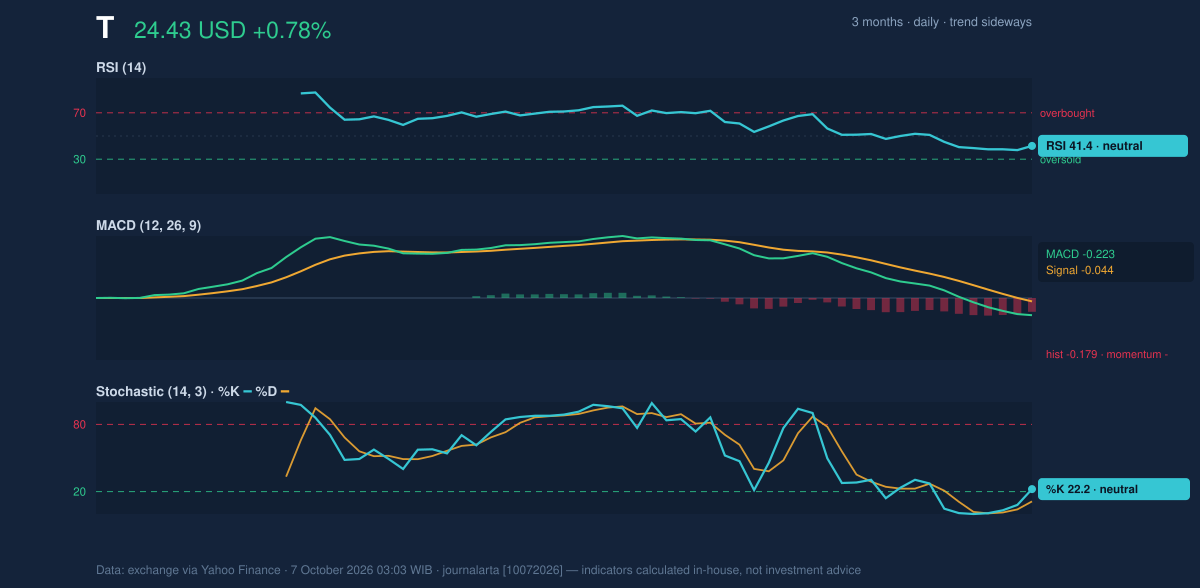
The momentum readings are mixed, but lean weak. RSI is 41.4, a neutral reading, below the midpoint commonly used to distinguish stronger from weaker momentum. RSI measures the pace of recent gains and losses; at this level, it does not indicate an extreme condition or, on its own, a reversal signal.
The Stochastic readings are also classified as neutral, with %K at 22.2 and %D at 11.2. Stochastic compares a closing price with its recent trading range. The low readings show that the stock is near the bottom of that range, but the supplied classification does not confirm a bullish turn.
MACD provides the clearest negative signal. MACD is -0.223, below its -0.044 signal line, with a -0.179 histogram. MACD compares shorter- and longer-term price averages to assess momentum; a negative reading below the signal line indicates that downward momentum remains in control. Together, the indicators show weakness without a strong oversold or reversal confirmation.
Volatility, Volume & Key Levels
AT&T’s ATR is $0.47, or 1.9% of the share price, pointing to moderate day-to-day volatility. ATR estimates the typical trading range, not direction, so it offers a measure of potential movement rather than evidence of a trend change.
Participation was below normal: the latest volume of 34.29 million shares was about 0.9 times the 20-day average of 38.18 million, while OBV was falling. On-balance volume tracks whether trading activity is accumulating on rising or falling sessions. Its decline, alongside lighter-than-average volume, suggests the recent price action has not been backed by strengthening buying participation.
The immediate test is support at $24.24. If price breaks below that level, the range floor would fail; if it holds and shares recover, $24.97 and $25.22 are the moving-average levels to watch before resistance at $26.72. A move above resistance would improve the chart structure, but the current momentum readings do not yet confirm that scenario.
Technical Verdict: HOLD
The technical balance supports HOLD (wait & see): the stock is below both moving averages, MACD remains negative, and declining OBV does not confirm buying strength. The neutral RSI and Stochastic readings, plus moderate rather than elevated volatility, keep the signals from forming a more decisive breakdown call. The verdict is invalidated if price falls below $24.24 support.
- Illustrative entry range: $24.24–$24.97, bounded by support and the 50-day SMA.
- Illustrative exit target: $26.72 resistance.
- Illustrative stop-loss protection: below $23.81, the lower Bollinger Band.
For non-traders, the chart is caught between nearby support and overhead resistance, with momentum still tilted lower.
| Indicator | Reading |
|---|---:|
| Last price | $24.43 |
| SMA20 / SMA50 | $25.22 / $24.97 |
| RSI(14) | 41.4 |
| MACD / signal / histogram | -0.223 / -0.044 / -0.179 |
| Support / resistance | $24.24 / $26.72 |
| ATR(14) | $0.47 (1.9%) |
Summary Data T
| Last price | 24.43 USD |
| Change 1 day / 5 days / 1 month | 0.78% / -0.20% / -4.57% |
| Trend / MA-cross | sideways / none |
| SMA20 / SMA50 | 25.22 / 24.97 |
| RSI (14) / Stochastic %K | 41.4 / 22.2 |
| Bollinger %B / ATR | 22% / 0.47 |
| Support / Resistance 20 days | 24.24 / 26.72 |
| Data as of | 7 October 2026 03:03 WIB |
Track T stock price daily: live levels, support/resistance and our full T analysis history.