On October 6, 2026: price 1,157.49 USD, trend sideways, RSI 47.8, support 1,115.70, resistance 1,184.78. technical analysis of lly stock.
By Elena Vance
October 7, 20264 min read
LLY Stock Gains 1.26% on Tuesday, Momentum Gains
Eli Lilly shares rose 1.26% to $1,157.49 on the New York Stock Exchange, according to exchange data via Yahoo Finance as of October 7, 2026, at 03:00 WIB. The daily gain followed a 2.29% decline over five trading days, leaving the stock caught between a small short-term rebound and a broader sideways pattern. The signals suggest a market searching for direction rather than a confirmed recovery.
Trend & Price Action
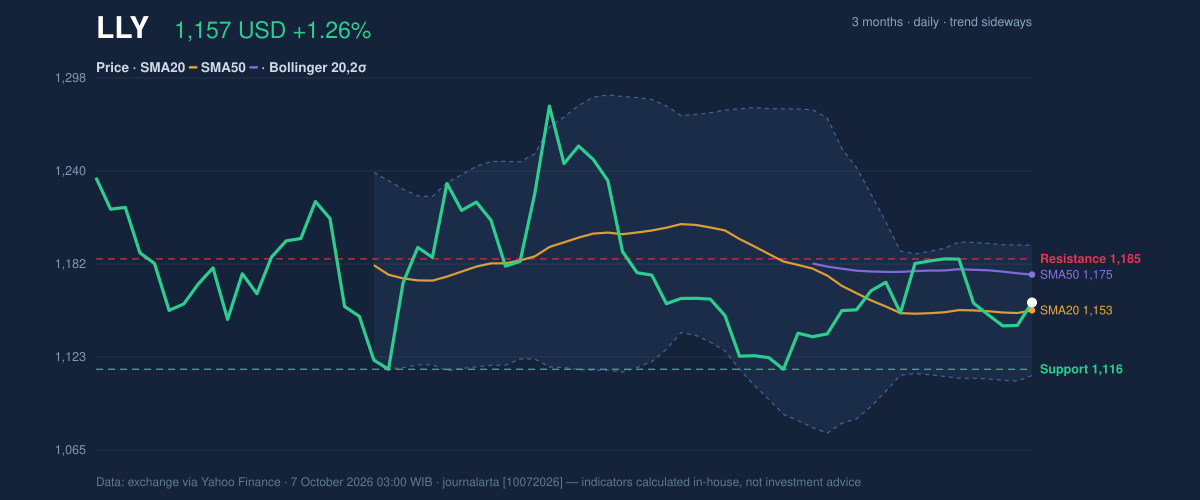
The price sits above its 20-day simple moving average (SMA), a measure of the average closing price over that period, but remains below its 50-day SMA. That puts the latest move in a mixed position: it has regained ground against the shorter trend, yet has not cleared the longer one. The 20-day average’s slope is almost flat, down 0.01% over five days, and there has been no recent moving-average crossover—so neither a bullish nor bearish trend change is confirmed.
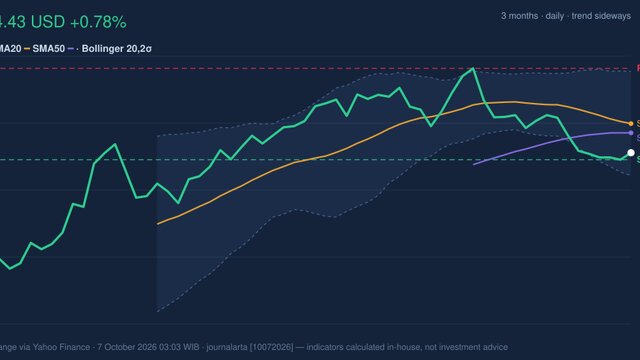
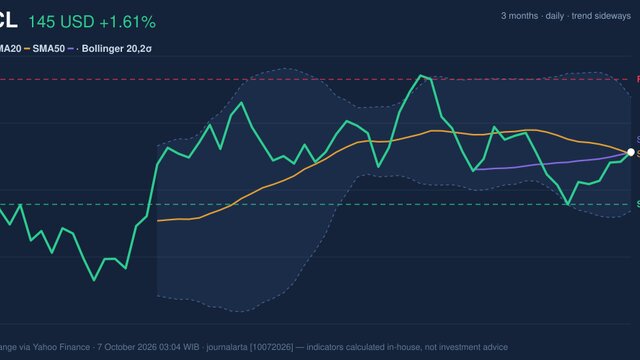
At 60% of its 20-day trading range, the stock is closer to resistance than support, though it remains well below its three-month high of $1,292.65. Its three-month low is $1,109.15. As shown in the chart, price is near the middle of the Bollinger Bands, which track recent price variation, rather than pressing against either boundary.
3-month price action chart of LLY: price, SMA20/50, Bollinger, support & resistance. Data: exchange via Yahoo Finance.
Oscillators & Momentum
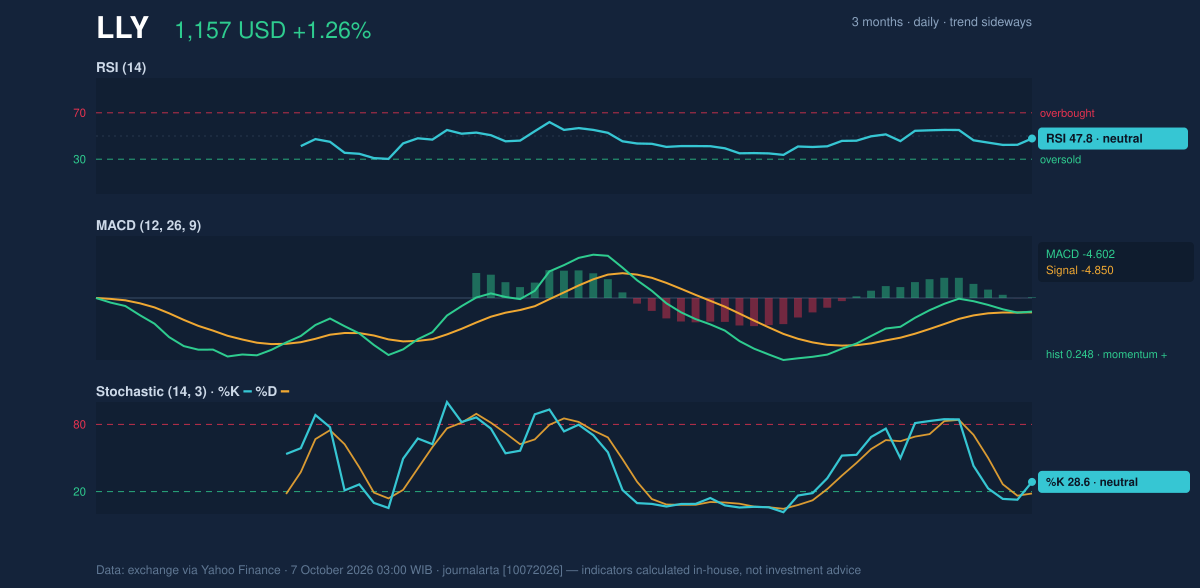
Momentum readings are mixed but not extreme. The RSI is neutral at 47.8; the Relative Strength Index measures the pace of recent gains and losses, and a reading near the midpoint signals neither strong buying nor pronounced selling pressure. The Stochastic indicator, which compares the latest close with its recent trading range, is also classified as neutral, with %K at 28.6 and %D at 18.3. Those lower readings show that the stock has been trading toward the bottom of its recent range, but do not by themselves confirm a reversal.
The MACD—the difference between two moving averages, used to gauge momentum—offers a modestly more positive signal. It remains below zero at -4.602, but is above its -4.850 signal line, leaving a positive histogram of 0.248. That means downward momentum may be easing; it does not yet show that the larger trend has turned upward.
Momentum chart of LLY: RSI(14), MACD, Stochastic. Data: exchange via Yahoo Finance.
Volatility & Volume
The Bollinger Band width is 7.1% and narrowing, a squeeze that signals reduced recent price variation and the potential for a sharper move if trading activity expands. The %B reading of 56% places the price slightly above the bands’ midpoint, consistent with a modest rebound rather than a surge toward the upper band. Squeezes do not predict direction: a breakout can be upward or downward.
The 14-day Average True Range (ATR), a measure of typical daily movement, is $32.29, or 2.8% of the share price, indicating moderate volatility. Volume was 2,131,000 shares, close to the 20-day average of 2,230,055. That near-normal activity does not show an unusually strong wave of participation behind the daily rise. Meanwhile, falling On-Balance Volume (OBV)—a running measure that adds volume on rising sessions and subtracts it on falling ones—suggests buying pressure has not yet convincingly confirmed the price rebound.
Key Levels & Scenarios
The nearest defined 20-day resistance is $1,184.78, with the upper Bollinger Band at $1,193.35. A sustained move through that zone would strengthen the case that the squeeze is resolving upward, especially if volume and OBV improve. Failure to clear resistance would leave the recent bounce vulnerable to renewed range-bound trading.
On the downside, 20-day support stands at $1,115.70, close to the lower Bollinger Band at $1,111.82 and the three-month low of $1,109.15. A break below that cluster would weaken the short-term structure and put the recent low into focus. The 20-day SMA at $1,152.58 is an intermediate reference: holding above it would preserve the current short-term footing, while a fall below it would tilt the balance back toward support.
Technical Verdict: HOLD (wait & see)
The verdict is HOLD (wait & see): price is above the 20-day SMA but below the 50-day SMA, leaving the trend unresolved; the MACD histogram is positive, but RSI and Stochastic remain neutral; and falling OBV does not confirm strong accumulation. The balance of evidence points to consolidation, not a confirmed directional breakout.
- Ideal entry range: $1,152.58–$1,115.70, spanning the 20-day SMA to 20-day support.
- Exit target: $1,184.78, the 20-day resistance level.
- Stop-loss protection: $1,109.15, the three-month low.
- Invalidation: The verdict is invalidated if the price falls below $1,109.15.
For non-traders, the indicators show a stock whose next move is not yet clear, with nearby support and resistance defining the current range.
Data source: Exchange data via Yahoo Finance, as of October 7, 2026, at 03:00 WIB. Technical analysis describes market signals and is not an investment recommendation.