Testing Key Resistance, AVGO Stock Gains 3.67% on Tuesday
On October 6, 2026: price 375.81 USD, trend sideways, RSI 59.1, support 339.27, resistance 375.81. technical analysis of avgo stock. Testing Key Resistance —…
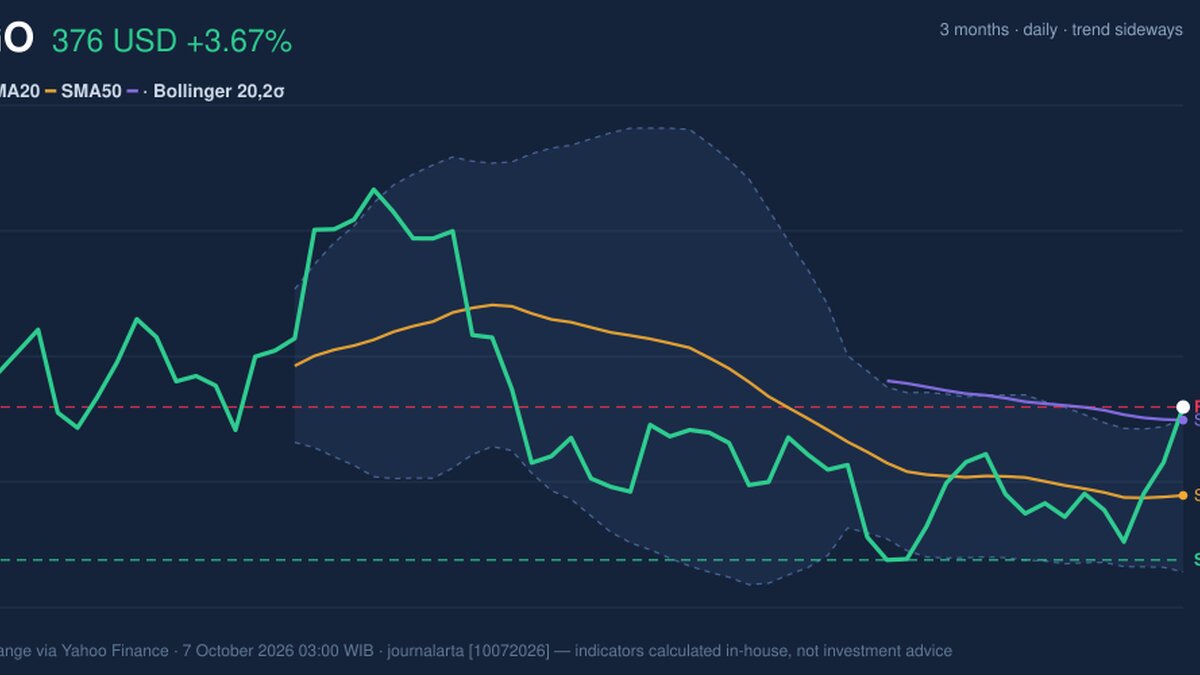
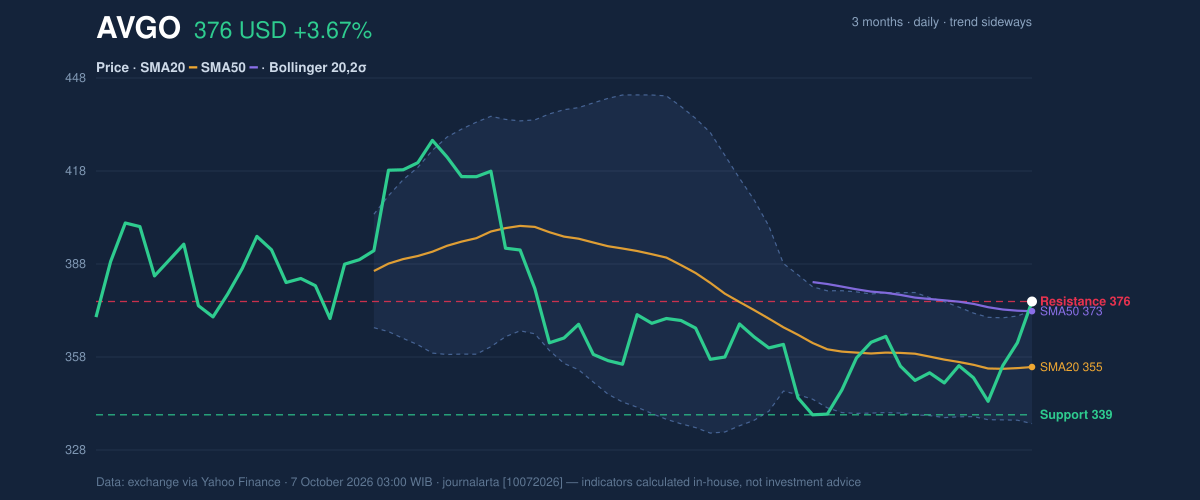
Broadcom’s shares rose 3.67% to $375.81, putting the chipmaker’s stock at the top of its recent trading range as investors weigh a forceful short-term rebound against mixed trend signals. The move matters beyond one company: Broadcom’s position in semiconductors and infrastructure software makes its share performance a closely watched gauge of demand for technology used in data centers and artificial intelligence.
The figures, sourced from exchange data via Yahoo Finance as of October 7, 2026, show the stock gained 5.83% over five trading days and 1.97% over one month. That acceleration has brought the price to its 20-trading-day resistance, but it has not yet turned the broader trend decisively upward.
Trend & Price Action
Broadcom trades above its 20-day simple moving average (SMA), at $354.70, and just above its 50-day SMA, at $372.69. The 20-day average is still sloping down, however, and there has been no new moving-average crossover. That combination points to a rebound within a sideways pattern, rather than clear evidence that a sustained uptrend has taken hold.
The immediate test is the $375.81 resistance level, which is also the current price and the upper edge of the 20-day range. The stock is therefore at 100% of that range. A move beyond resistance could indicate that recent buying is overcoming the near-term ceiling; failure to hold the breakout area could leave the advance vulnerable to a pullback toward moving-average support.
The three-month high of $432.73 remains well above the current price, while the three-month low of $335.81 sits close to the 20-day support at $339.27. Those boundaries show that the latest rally has not erased the distance from the prior high, and that support matters if the price retreats.
Oscillators & Momentum
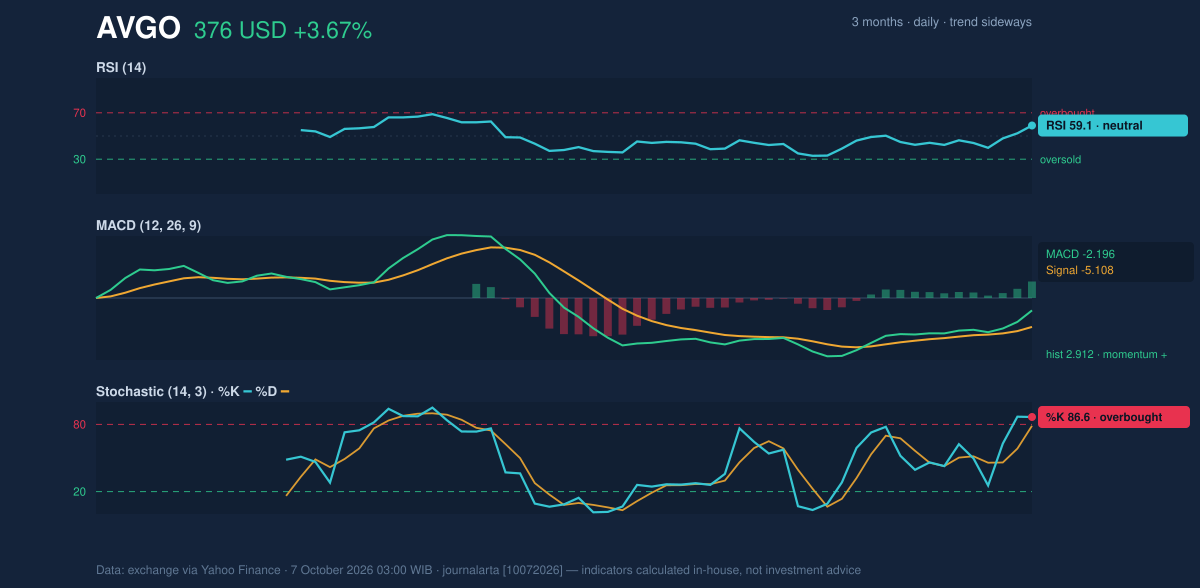
Momentum indicators are improving, but they do not give a uniform signal. The RSI is 59.1, a neutral reading: it suggests positive momentum without showing that the share price is broadly stretched by this measure. The Stochastic is overbought, with %K at 86.6 and %D at 78.8. That indicator’s high reading warns that the rapid climb may be due for a pause, although an overbought signal on its own does not establish that a reversal has begun.
The MACD offers a counterweight. Its reading is -2.196, below zero, but above the signal line at -5.108; the positive histogram of 2.912 indicates that short-term momentum is improving. In plain terms, the recovery is gaining pace even though the indicator has not yet crossed into positive territory. This is consistent with an early rebound, not definitive confirmation of a lasting trend change.
Volatility & Volume
The share price is above the upper Bollinger Band at $372.95, with %B at 108%. Bollinger Bands plot a typical range around a moving average; a price above the upper band signals that trading has stretched beyond that range. The band width is 10.3%, described as normal, so the move is not accompanied by an unusually narrow setup or a sudden expansion in measured volatility.
Average True Range (ATR), a measure of typical daily price movement, is $10.62, or 2.8% of the share price, indicating moderate volatility. Volume was 30,791,100 shares, about 1.3 times the 20-day average of 24,485,320, while On-Balance Volume (OBV) is rising. Higher-than-usual trading alongside rising OBV suggests the advance has attracted participation, rather than occurring on thin volume. It cannot, by itself, resolve whether resistance will hold.
Key Levels & Scenarios
The chart’s immediate reference points are the $375.81 resistance and $339.27 support, with the 50-day SMA at $372.69 and 20-day SMA at $354.70 offering additional context. A sustained move above resistance would strengthen the case that buyers are extending the rebound. If the price falls back below the 50-day average, the breakout attempt would look less secure; a decline through $339.27 would undermine the near-term support structure.
Technical Verdict: HOLD (wait & see)
The indicators support a wait-and-see reading rather than a clear directional signal. The price is above both moving averages, but the 20-day average still slopes down and no new crossover has formed. MACD momentum is improving and volume is above average, while the Stochastic’s overbought reading and the price’s position above the upper Bollinger Band raise the risk of a near-term pause.
The verdict is invalidated if the price falls below $339.27, the 20-day support level.
- Ideal Entry Range: $354.70–$372.69, bounded by the 20-day and 50-day SMAs.
- Exit Target: $375.81, the current 20-day resistance level.
- Stop Loss: $339.27, the 20-day support level.
For non-traders, the signals are mixed: the rebound has participation behind it, but the stock is pressing against resistance while some momentum readings are stretched.
| Indicator | Reading |
|---|---|
| Last price | $375.81 |
| 20-day SMA / 50-day SMA | $354.70 / $372.69 |
| RSI(14) | 59.1, neutral |
| Stochastic %K / %D | 86.6 / 78.8, overbought |
| MACD / signal / histogram | -2.196 / -5.108 / 2.912 |
| 20-day support / resistance | $339.27 / $375.81 |
| Volume / 20-day average | 30,791,100 / 24,485,320 |
Summary Data AVGO
| Last price | 375.81 USD |
| Change 1 day / 5 days / 1 month | 3.67% / 5.83% / 1.97% |
| Trend / MA-cross | sideways / none |
| SMA20 / SMA50 | 354.70 / 372.69 |
| RSI (14) / Stochastic %K | 59.1 / 86.6 |
| Bollinger %B / ATR | 108% / 10.62 |
| Support / Resistance 20 days | 339.27 / 375.81 |
| Data as of | 7 October 2026 03:00 WIB |
Track AVGO stock price daily: live levels, support/resistance and our full AVGO analysis history.