On October 6, 2026: price 286.69 USD, trend downtrend, RSI 33.3, support 281.15, resistance 310.87. technical analysis of hd stock. HD Stock Analysis — full…
By Elena Vance
October 7, 20263 min read
HD Stock Analysis
Home Depot closed at $286.69, up 1.97% on the day, but the rebound has yet to reverse a broader decline, according to market data from the exchange via Yahoo Finance. The stock remains below its falling 20-day average and its 50-day average, while monthly performance is down 8.61%. That gap between a positive session and a weaker underlying trend matters: one day’s gain is not yet evidence that buyers have regained control.
Trend & Price Action
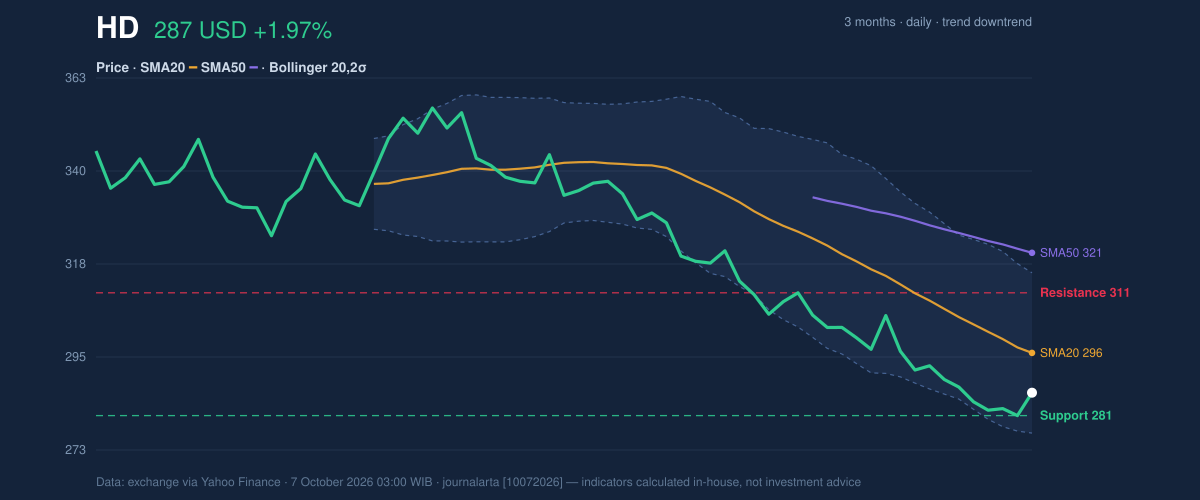
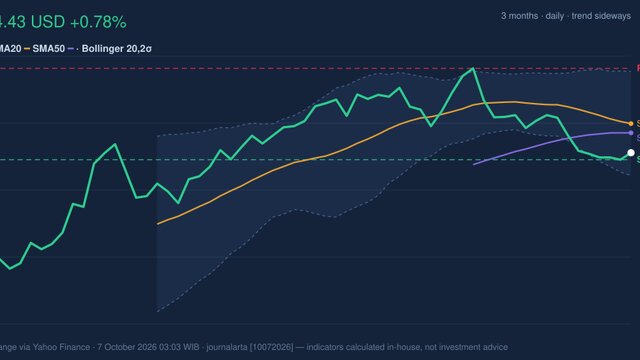
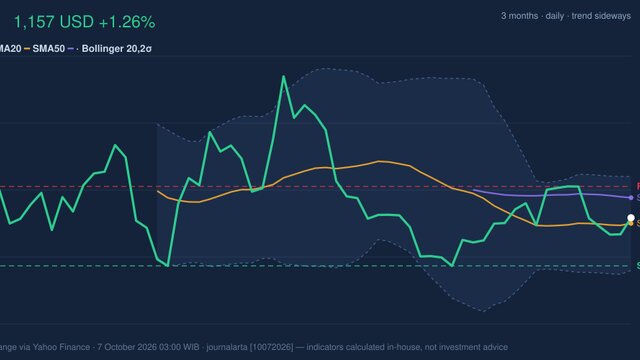
HD’s last price is below its 20-day simple moving average of $296.32 and its 50-day average of $320.56. The 20-day average has fallen 2.84% over five trading days, reinforcing the downtrend rather than showing a flattening base. There has been no new moving-average crossover, so the data offer no fresh signal that the short-term trend has turned.
The stock sits in the lower portion of its recent range: 19% of the way between the 20-day support at $281.15 and resistance at $310.87. Its three-month high and low are $358.36 and $277.15, respectively. The distance from the high shows how much ground the shares have lost; proximity to the low makes the $281.15 area an important near-term test.
3-month price action chart of HD: price, SMA20/50, Bollinger, support & resistance. Data: exchange via Yahoo Finance.
Oscillators & Momentum
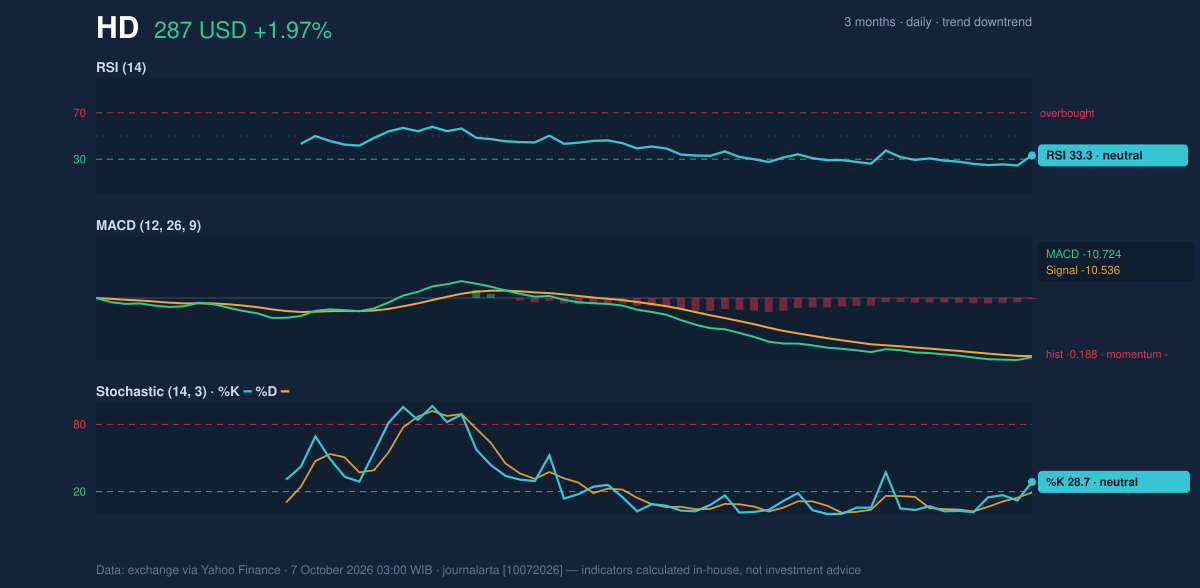
The momentum readings are weak, though not uniform. RSI is 33.3, classified as neutral in the supplied data. RSI compares the scale of recent gains and losses; a low reading can indicate persistent selling, but this figure alone does not establish a reversal. Stochastic %K at 28.7 and %D at 19.2 are also classified as neutral, with both readings close to the lower end of their range.
MACD remains negative at -10.724, just below its -10.536 signal line, and its histogram is -0.188. That configuration means downward momentum still has a slight edge, even as the gap between MACD and its signal line is narrow. A sustained move back above the averages would be more convincing evidence of a shift than a single positive close.
Momentum chart of HD: RSI(14), MACD, Stochastic. Data: exchange via Yahoo Finance.
Volatility & Volume
The Bollinger reading places HD near the lower part of its recent price envelope. The bands run from $276.92 to $315.72, with the middle line at $296.32; %B is 25%. In plain terms, price is closer to the lower band than the upper one, consistent with recent pressure, but the band width of 13.1% is described as normal rather than a volatility squeeze or an unusually sharp expansion.
ATR is $6.40, or 2.2% of the share price, indicating moderate daily price movement by this measure. Volume was 4,502,100 shares, below the 20-day average of 5,172,600, while OBV is falling. OBV tracks whether volume tends to accompany rising or falling prices; its decline alongside lighter-than-average turnover offers little confirmation that the latest bounce reflects broad accumulation.
Key Levels & Scenarios
The immediate test is $281.15, the stated 20-day support. If HD falls below that level, the chart would show a break beneath near-term support and could bring the three-month low of $277.15 into focus. If support holds, a recovery would still need to contend with the 20-day average at $296.32 before the $310.87 resistance area; clearing that zone would be a stronger sign of repair, but would not by itself erase the longer-term weakness below the 50-day average.
3-month price action chart of HD: price, SMA20/50, Bollinger, support & resistance. Data: exchange via Yahoo Finance.
Technical Verdict: HOLD
HOLD (wait & see) reflects a mixed setup: the downtrend and negative MACD argue against calling a reversal, while neutral RSI and Stochastic readings and the absence of an extreme Bollinger squeeze leave room for a stabilization attempt. The falling OBV and below-average volume do not confirm the one-day rise.
The verdict is invalidated if price falls below $281.15, the stated near-term support.
- Ideal entry range: $281.15–$296.32, bounded by 20-day support and the 20-day average.
- Exit target: $310.87, the stated 20-day resistance.
- Stop-loss protection: below $276.92, the lower Bollinger Band.
In plain English, the indicators show a weak trend but no decisive breakdown signal above support.
Data: Exchange data via Yahoo Finance, as of 7 October 2026, 03:00 WIB.