HSBC Stock Technicals: Gains 1.93% on Tuesday, Momentum Weakens
On October 6, 2026: price 152.80 HKD, trend downtrend, RSI 37.7, support 149.50, resistance 166.00. technical analysis of hsbc stock. HSBC Stock Technicals —…
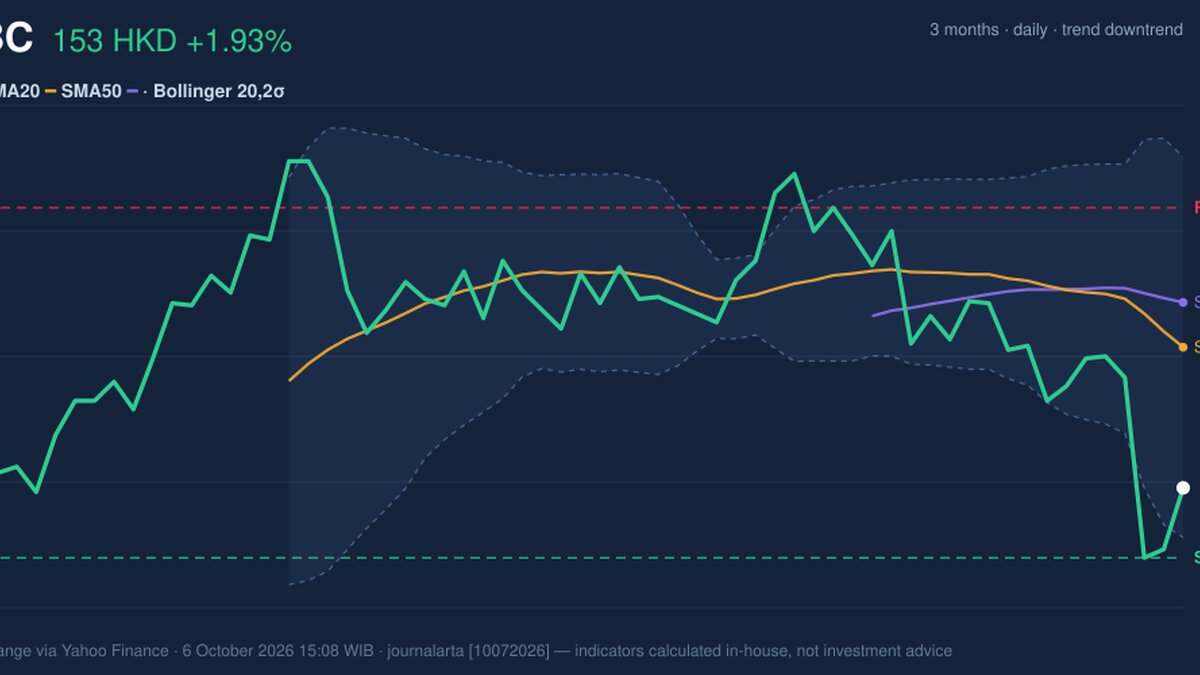
HSBC Holdings rose 1.93% to HK$152.80 on 6 October, but the rebound has yet to reverse a broader decline: the shares are down 3.84% over five trading days and 8.83% over one month. The latest price remains below both the 20-day and 50-day moving averages, while negative MACD readings point to momentum that is still working against a sustained recovery.
Trend & Price Action
The chart places HSBC near the lower end of its recent trading range, at 20% of the distance between the 20-day support and resistance levels. The 20-day moving average is HK$159.43 and the 50-day average is HK$161.54, both above the current price. The 20-day average is also sloping down, falling 1.60% over five days. This signals that the share’s near-term trend remains weak, even after the day’s advance. There has been no new moving-average crossover to suggest a change in direction.
The three-month high and low are HK$169.70 and HK$147.60. HSBC is therefore closer to the period low than the high. A rise from the previous close is a useful sign of demand on the day, but it does not yet offset the longer run of losses.
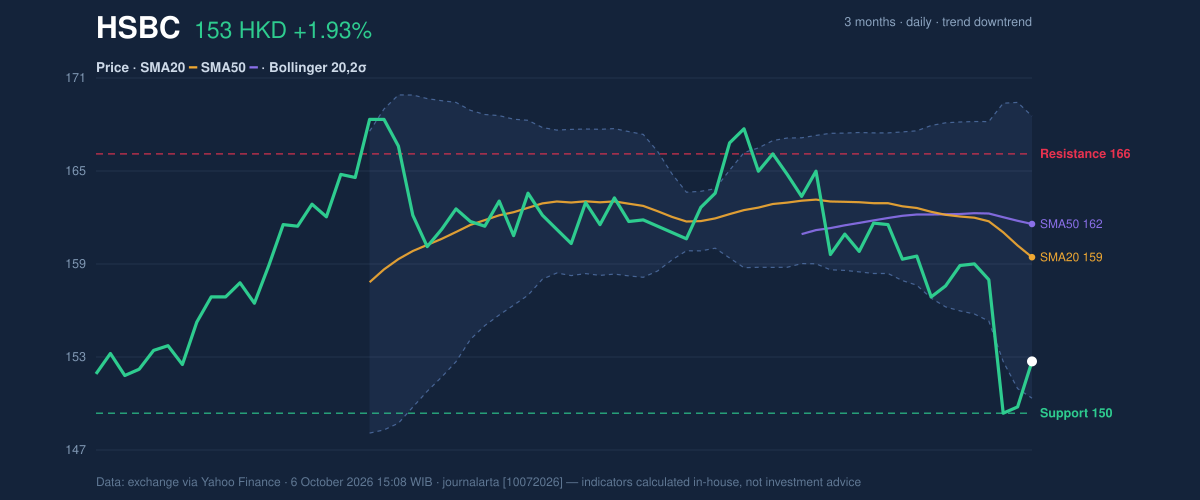
The Bollinger Bands, which track price movement around a moving average, put HSBC close to the lower boundary: the lower band is HK$150.46, and the %B reading is 13%. That low reading shows the price is near the bottom of its recent volatility range, but it is not proof of a reversal. The band width is 11.3%, described as normal, so there is no clear signal of unusually compressed trading or a volatility breakout.
Oscillators & Momentum
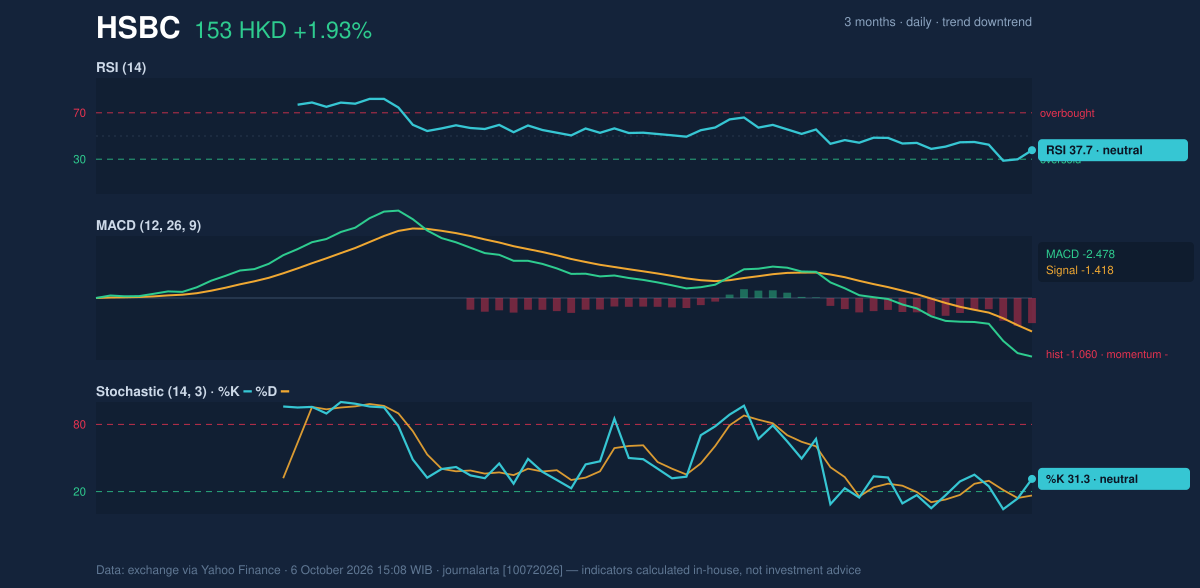
RSI is 37.7, while Stochastic %K is 31.3 and %D is 16.5. These readings are labelled neutral in the supplied data: they indicate soft momentum, but do not establish that the shares have reached an oversold condition. RSI measures the pace of recent gains and losses; Stochastic compares a closing price with its recent range. Neither currently confirms a decisive turn higher.
MACD is negative at -2.478, below its -1.418 signal line, with a -1.060 histogram. The gap indicates downside momentum remains in place. That matters because the one-day rise has not yet been confirmed by the broader momentum measure; a stronger signal would require those readings to improve.
Volatility, Volume & Key Levels
Average True Range, a measure of typical price movement, is HK$3.11, or 2.0% of the share price, pointing to moderate volatility. The latest volume was 8.14 million shares, about 0.8 times the 20-day average of 9.85 million. The rise therefore came on below-average turnover, tempering its force as evidence of broad participation. On the other hand, OBV is rising; this measure accumulates volume on up days and subtracts it on down days, suggesting buying pressure has not disappeared entirely.
Support sits at HK$149.50, just below the lower Bollinger Band and close to the three-month low of HK$147.60. Holding that area would keep the recent rebound intact; a break below it would weaken the price structure and put the period low back in focus. On the upside, the 20-day resistance is HK$166.00. Before reaching it, the price would need to regain the 20-day average at HK$159.43 and then the 50-day average at HK$161.54. A move above resistance would challenge the current downtrend, but the negative MACD makes that scenario unconfirmed.
Technical Verdict: HOLD (wait & see)
HOLD (wait & see) fits the mixed technical picture: the price is near support and OBV is rising, but it remains below falling short-term averages, MACD momentum is negative, and trading volume was below its 20-day norm. The verdict is invalidated if the price falls below HK$149.50, the stated 20-day support.
- Ideal Entry Range: HK$149.50–HK$150.46, based on 20-day support and the lower Bollinger Band.
- Exit Target (Target Price): HK$166.00, the 20-day resistance.
- Stop Loss: Below HK$149.50, aligned with the support level and the invalidation condition.
In plain English, HSBC has bounced for a day, but the chart has not yet shown that its decline is over.
Summary Data HSBC
| Last price | 152.80 HKD |
| Change 1 day / 5 days / 1 month | 1.93% / -3.84% / -8.83% |
| Trend / MA-cross | downtrend / none |
| SMA20 / SMA50 | 159.43 / 161.54 |
| RSI (14) / Stochastic %K | 37.7 / 31.3 |
| Bollinger %B / ATR | 13% / 3.11 |
| Support / Resistance 20 days | 149.50 / 166.00 |
| Data as of | 6 October 2026 15:08 WIB |
Track HSBC share price daily: live levels, support/resistance and our full HSBC analysis history.