Momentum Weakens, MRK Stock Gains 1.72% on Tuesday
On October 6, 2026: price 141.94 USD, trend sideways, RSI 43.2, support 139.54, resistance 150.91. technical analysis of mrk stock. Momentum Weakens — full…
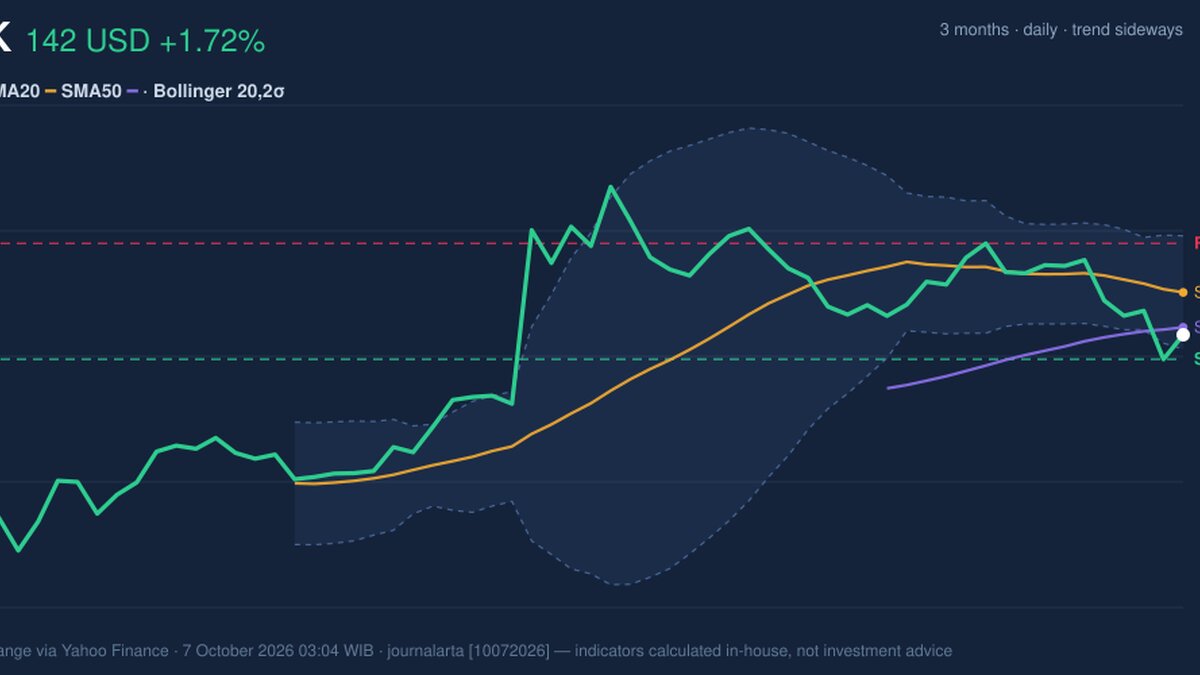
Merck’s shares rose 1.72% to $141.94 on the latest session, but the rebound has not erased losses over the past week or month. For international investors, the tension is between a one-day recovery and a price still below its short-term trend line, with momentum and trading activity offering little confirmation of a sustained turn.
Trend & Price Action
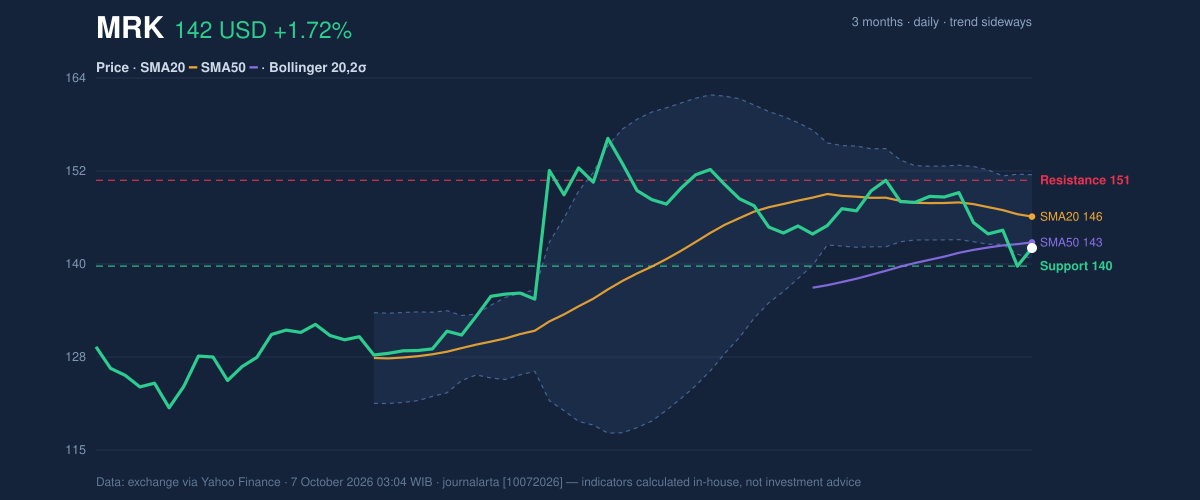
The close was above the prior session’s $139.54, yet MRK remained below its 20-day simple moving average (SMA) of $146.09 and its 50-day SMA of $142.68. An SMA averages recent closing prices to make the direction of a trend easier to see. Here, the price structure remains fragile: the 20-day average is falling, down 1.27% over five trading days, while the stock has lost 4.92% in five days and 4.39% over one month. There has been no new crossover between the two averages to signal a decisive change in trend.
The session’s gain is a bounce, not yet a confirmed trend reversal. MRK sits in the lower portion of its 20-trading-day range, closer to support at $139.54 than to resistance at $150.91. Its three-month range, from $120.16 to $156.92, shows that the current weakness has not taken the stock to its recent low, but that wider range does not remove the near-term pressure.
The Bollinger Bands reinforce the cautious reading. These bands track price relative to its recent average; MRK’s position at 13% of the band range places it near the lower band, at $140.54, with the middle band at $146.09 and the upper band at $151.65. The bands are narrowing, a squeeze that signals subdued recent volatility and the potential for a larger move, but does not predict its direction.
Oscillators & Momentum
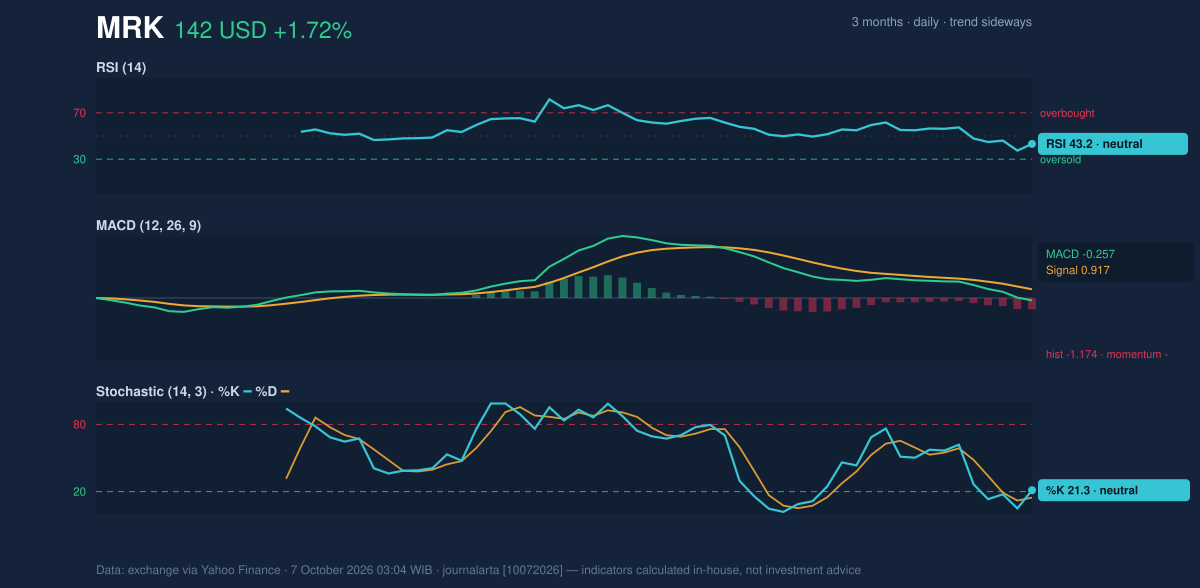
The indicators are mixed, but lean weak. The relative strength index (RSI), which gauges the pace of recent gains and losses, is 43.2 and classified as neutral. Stochastic readings are also labelled neutral, with %K at 21.3 and %D at 14.6. Their low readings show that the stock is trading near the lower end of its recent range; they do not, by themselves, establish that a recovery has begun.
MACD, a trend-momentum measure, is negative at -0.257 against a signal line of 0.917, leaving its histogram at -1.174. That negative MACD configuration points to weakening momentum, and contrasts with the day’s price gain. A stronger case for a turn would require the price to recover key averages alongside improving momentum, rather than rely on a single positive session.
Volatility & Volume
Average true range (ATR), a measure of typical price movement, is $3.54, or 2.5% of the share price—moderate volatility by the supplied data. That makes the narrowing Bollinger Bands notable: volatility has compressed even as momentum remains negative, leaving a potential breakout without a clear directional signal.
Participation was light. Volume of 8,072,700 shares was about 0.8 times the 20-day average of 9,928,825, while on-balance volume (OBV)—a running measure that adds volume on rising days and subtracts it on falling days—was declining. The low-volume rebound lacks strong evidence of broad buying pressure.
Key Levels & Scenarios
The immediate test is support at $139.54, close to the lower Bollinger Band at $140.54. A failure to hold that area would weaken the near-term structure further. A recovery above the 50-day SMA at $142.68 would be an initial improvement; a move through the 20-day SMA and band midpoint at $146.09 would provide stronger evidence that pressure is easing. The next stated resistance is $150.91, below the upper Bollinger Band at $151.65.
These are conditional levels, not forecasts: a support break would raise downside risk, while a sustained recovery through the moving averages would challenge the current weak-momentum reading.
Technical Verdict: HOLD (wait & see)
The technical verdict is HOLD (wait & see): price remains below both moving averages, MACD momentum is negative, and falling OBV with below-average volume fails to confirm the rebound. The neutral RSI and compressed Bollinger Bands temper that weakness, but neither supplies a directional trigger. The verdict is invalidated if price falls below $139.54 support.
- Ideal Entry Range: $139.54–$142.68, using the stated support and 50-day SMA as reference levels.
- Exit Target (Target Price): $150.91, the stated 20-trading-day resistance.
- Stop Loss: Below $139.54, the stated support level.
In plain English, the indicators do not yet show whether the latest rise can overcome the stock’s short-term weakness.
*Data table — MRK, NYSE (US), as of 7 October 2026, 03:04 WIB. Source: exchange data via Yahoo Finance.*
| Indicator | Reading |
|---|---:|
| Last price | $141.94 |
| Previous close | $139.54 |
| Change | 1 day: +1.72%; 5 days: -4.92%; 1 month: -4.39% |
| Trend | Sideways; SMA20 slope: -1.27% over 5 trading days |
| SMA20 / SMA50 | $146.09 / $142.68 |
| Bollinger Bands | Upper $151.65; middle $146.09; lower $140.54; %B 13%; width 7.6%, narrowing |
| RSI(14) | 43.2, neutral |
| Stochastic | %K 21.3 / %D 14.6, neutral |
| MACD | -0.257; signal 0.917; histogram -1.174 |
| ATR(14) | $3.54, or 2.5% of price |
| Volume / 20-day average | 8,072,700 / 9,928,825 (0.8×) |
| OBV | Falling |
| Support / resistance | $139.54 / $150.91 |
| Three-month high / low | $156.92 / $120.16 |
Summary Data MRK
| Last price | 141.94 USD |
| Change 1 day / 5 days / 1 month | 1.72% / -4.92% / -4.39% |
| Trend / MA-cross | sideways / none |
| SMA20 / SMA50 | 146.09 / 142.68 |
| RSI (14) / Stochastic %K | 43.2 / 21.3 |
| Bollinger %B / ATR | 13% / 3.54 |
| Support / Resistance 20 days | 139.54 / 150.91 |
| Data as of | 7 October 2026 03:04 WIB |
Track MRK stock price daily: live levels, support/resistance and our full MRK analysis history.