NKE Stock Gains 1.91% on Tuesday, Momentum Weakens
On October 6, 2026: price 34.61 USD, trend downtrend, RSI 35.5, support 33.87, resistance 37.35. technical analysis of nke stock. NKE Stock Gains — full…
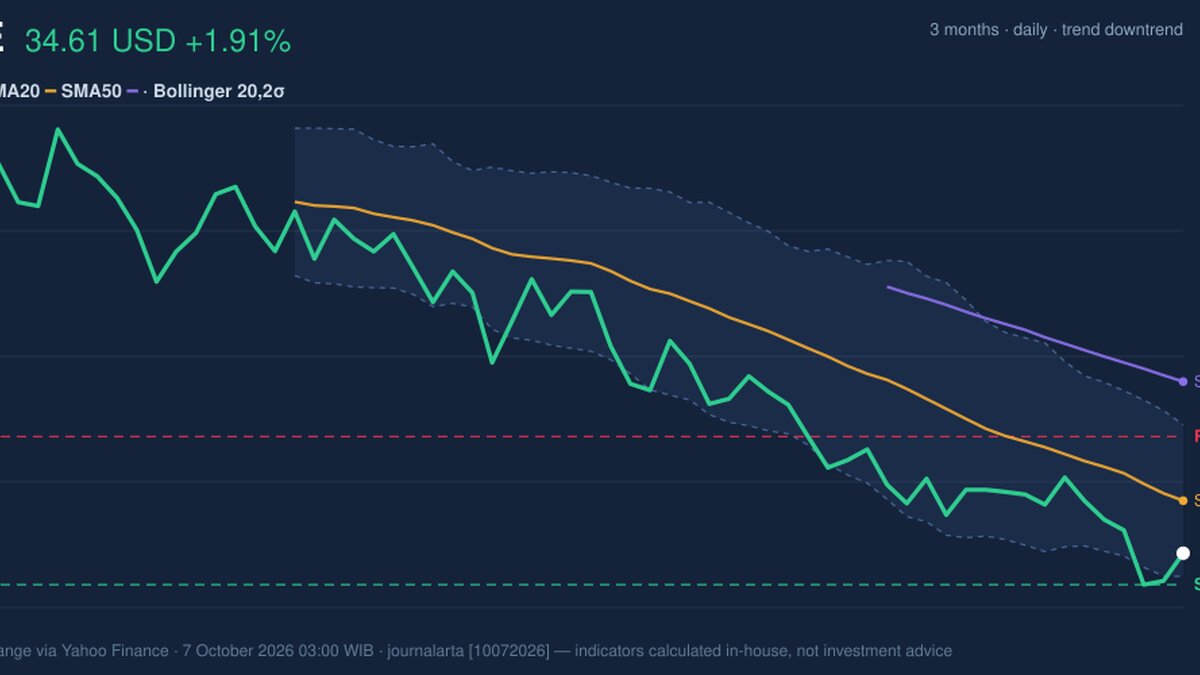
Nike rose 1.91% to $34.61 on the latest session, according to exchange data carried by Yahoo Finance as of October 7, 2026, but the daily bounce has not yet altered the broader technical picture. The shares remain in a downtrend: price is below both the 20-day and 50-day moving averages, and the shorter average is sloping lower. That makes the session’s gain a tentative pause in selling pressure, rather than confirmation that the trend has turned.
Trend & Price Action
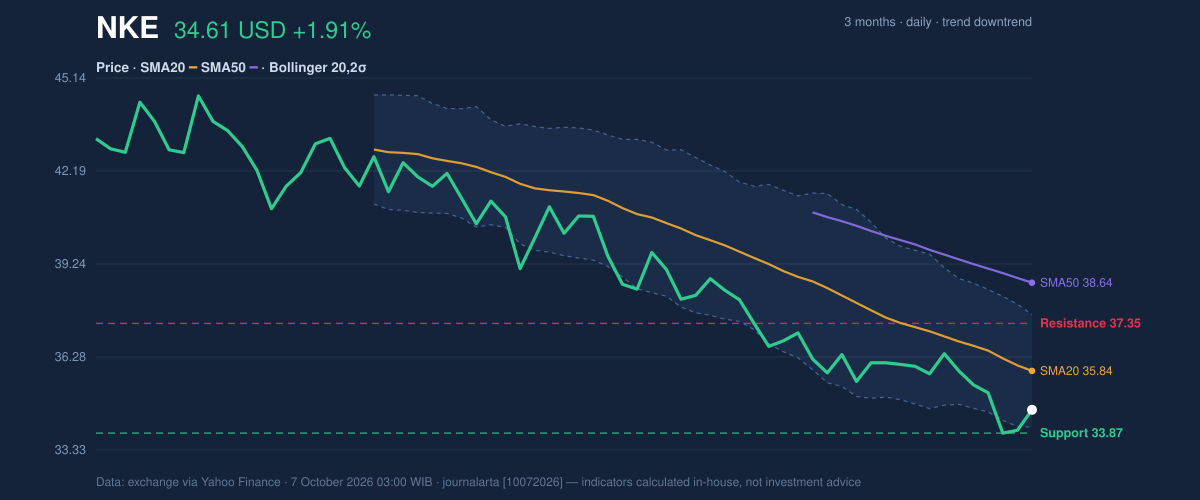
Nike’s last price is below its $35.84 20-day average and its $38.64 50-day average. The gap matters because moving averages smooth out daily fluctuations: trading beneath both suggests the recent weakness extends beyond a single session. The 20-day average has fallen 2.53% over five days, while the stock is down 3.43% over five days and 9.16% over one month. There has been no new moving-average crossover, so the chart offers no fresh signal of a change in trend.
The stock sits in the lower part of its recent trading range: the 20-day support and resistance band runs from $33.87 to $37.35, and the price is 21% of the way up from the lower boundary. Its three-month high and low are $44.98 and $31.97, respectively. The distance from the high puts the recent decline in perspective; the position near the range floor makes the $33.87 area a near-term test.
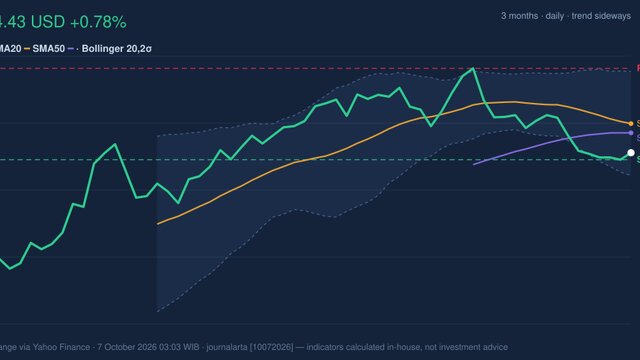
The Bollinger Bands, which show how far price is moving from its recent average, are at $34.06 on the lower side and $37.63 on the upper side, with a middle line of $35.84. At 15% of the way through the bands, Nike is near the lower boundary. But the band width is a normal 10.0%, not unusually narrow or wide, so the data do not point to a major volatility squeeze or expansion. As shown in the chart, the immediate question is whether price can reclaim the moving-average area or instead retest support.
Oscillators & Momentum
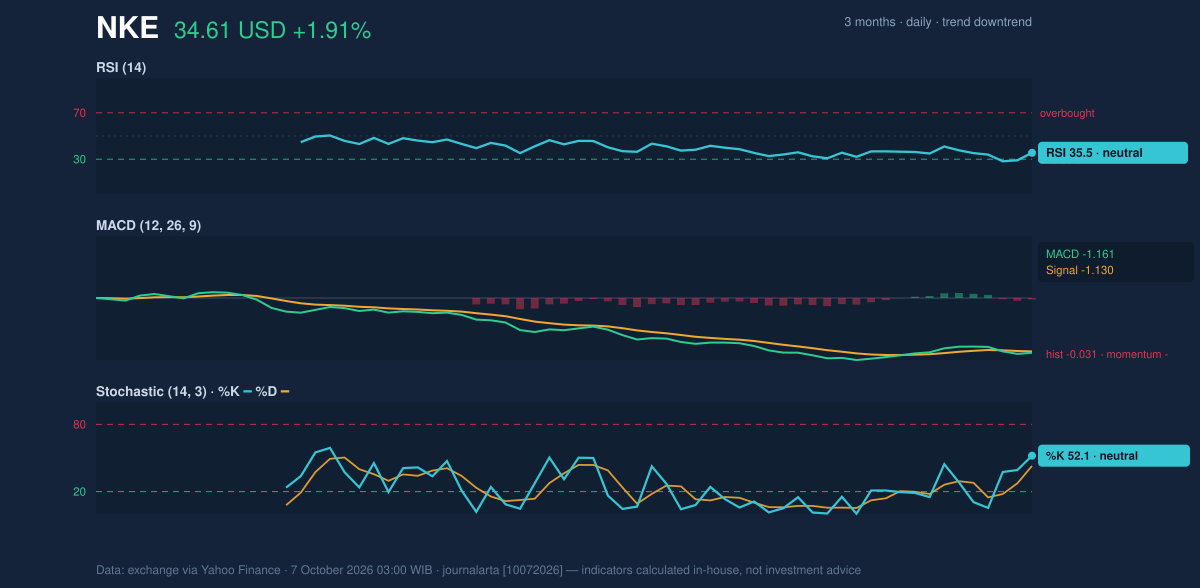
Momentum indicators show weakness, but not a uniform oversold signal. The RSI is 35.5, in the data’s neutral classification. RSI compares recent gains and losses; a reading in this zone reflects subdued buying momentum without, on its own, proving that selling has reached an extreme. The Stochastic readings are also classified as neutral, with %K at 52.1 and %D at 42.9. Their relative position suggests some short-term improvement, but it is not enough to outweigh the declining trend.
The MACD, a measure of trend momentum, remains negative: MACD is -1.161, below its -1.130 signal line, and the histogram is -0.031. The negative histogram means momentum is still marginally weaker than the signal line, even as the latest session advanced. That divergence between a positive one-day move and negative MACD calls for caution in interpreting the bounce.
Volatility, Volume & Key Levels
Trading volume was 50,030,300 shares, or 1.1 times the 20-day average. That is modestly above normal and indicates the advance attracted somewhat more participation than an ordinary session. Yet on-balance volume (OBV), which tracks whether volume is accumulating on up days or down days, is falling. The volume picture therefore does not yet confirm sustained buying.
Average true range, a measure of typical price movement, is $1.19, equal to 3.4% of the share price. That points to moderate volatility: moves around support and resistance may be meaningful, but the data do not describe an unusually turbulent trading range.
The key nearby floor is $33.87 support, close to the $34.06 lower Bollinger Band. If price holds that area and rises above $35.84, the 20-day average, the rebound would gain a more credible technical foothold. A move toward $37.35 resistance would then test the top of the 20-day range. If support gives way, the three-month low at $31.97 becomes the next reference in the supplied data—not a forecast, but a prior low traders may watch.
Technical Verdict: HOLD
The technical verdict is HOLD (wait & see). The case rests on three signals: price remains below both declining or higher moving averages, MACD momentum is negative, and OBV is falling despite above-average session volume. Against that, the stock is near short-term support and the RSI and Stochastic readings are neutral rather than decisively oversold. The verdict is invalidated if price falls below $33.87 support.
- Indicative entry range: $33.87–$35.84, bounded by 20-day support and the 20-day average.
- Indicative exit target: $37.35, the 20-day resistance level.
- Indicative stop-loss protection: below $33.87, the stated 20-day support.
For non-traders, HOLD means the chart has not yet settled whether Nike’s one-day rise marks a turn or merely a pause in its decline.
Summary Data NKE
| Last price | 34.61 USD |
| Change 1 day / 5 days / 1 month | 1.91% / -3.43% / -9.16% |
| Trend / MA-cross | downtrend / none |
| SMA20 / SMA50 | 35.84 / 38.64 |
| RSI (14) / Stochastic %K | 35.5 / 52.1 |
| Bollinger %B / ATR | 15% / 1.19 |
| Support / Resistance 20 days | 33.87 / 37.35 |
| Data as of | 7 October 2026 03:00 WIB |
Track NKE stock price daily: live levels, support/resistance and our full NKE analysis history.