PG Testing Key Resistance: Stock Gains 1.69% (October 6, 2026)
On October 6, 2026: price 148.41 USD, trend sideways, RSI 55.9, support 142.64, resistance 149.03. technical analysis of pg stock. PG Testing Key Resistance —…
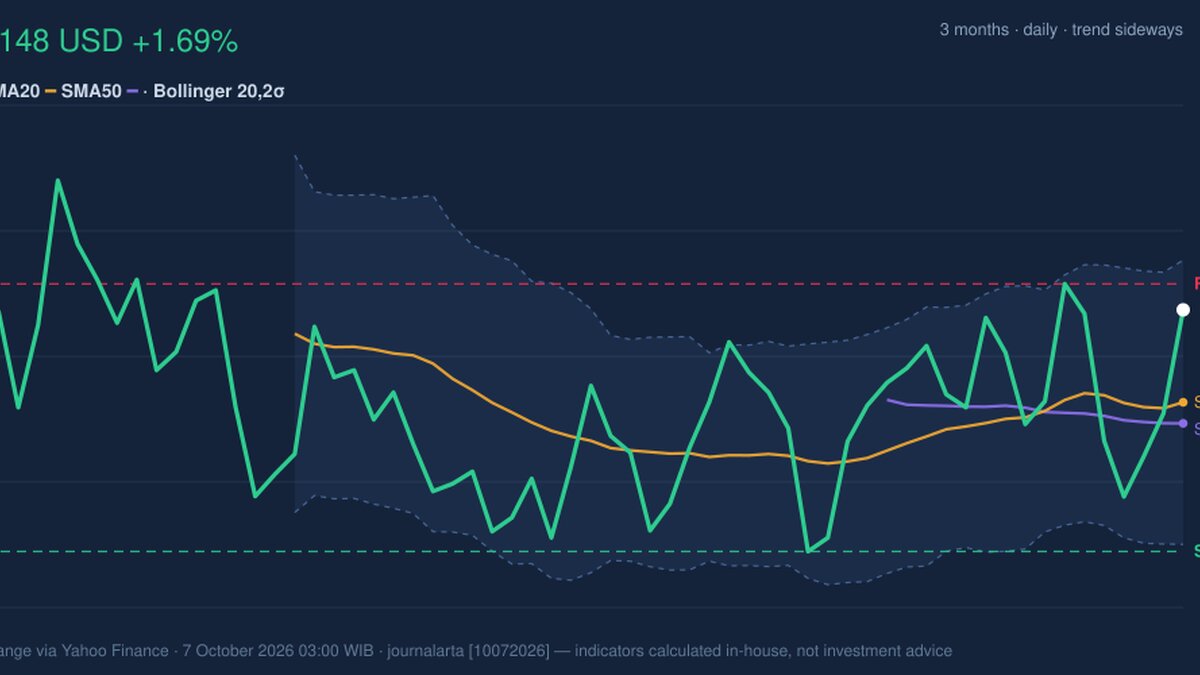
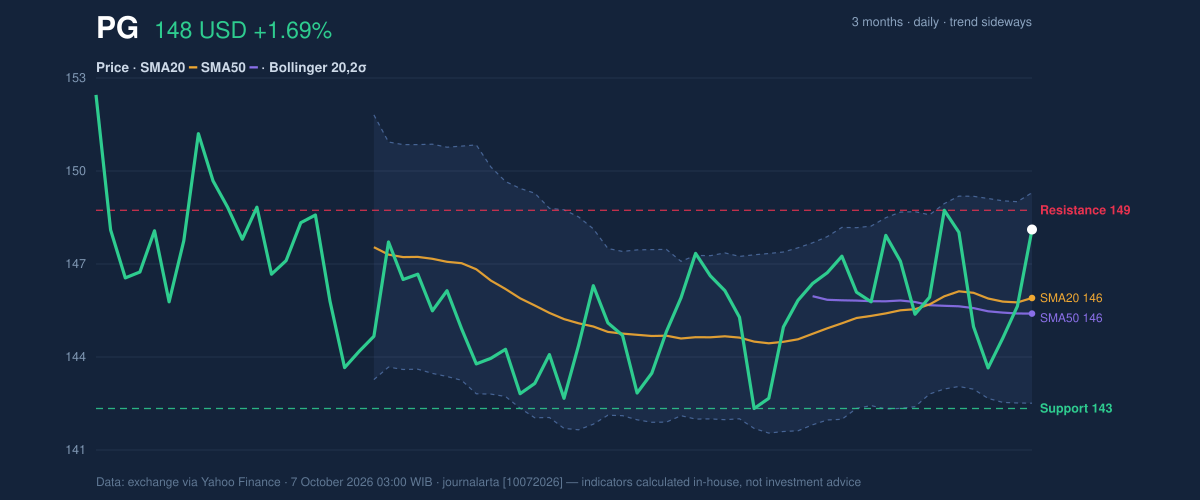
PG rose 1.69% to $148.41 on Oct. 7, extending a modest monthly gain as volume surged above its recent average. The move puts Procter & Gamble shares near the top of their 20-session range, but the broader trend remains sideways: price is above its short- and medium-term averages, while the 20-day average is still edging lower. That mix points to improving near-term demand, not yet a confirmed change in trend.
The latest market data are from the exchange via Yahoo Finance, as of 03:00 WIB on Oct. 7, 2026. PG’s five-day gain was only 0.06%, and its one-month rise was 1.94%, suggesting the sharp daily advance has not yet translated into sustained momentum.
Trend & Price Action
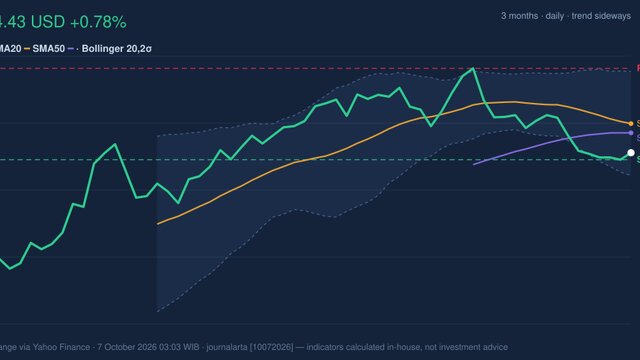
At $148.41, PG is above its 20-day simple moving average (SMA) of $146.20 and its 50-day SMA of $145.70. A simple moving average smooths price swings to show the prevailing direction; the fact that both averages sit below the share price supports the recent recovery. But the 20-day average’s 0.15% decline over five sessions tempers that signal, and no fresh crossover between the averages has formed.
The price structure is constructive in the short term, but still lacks a clear trend confirmation. Shares are at 90% of their 20-session range, close to resistance at $149.03. The three-month high of $154.32 remains above that near-term ceiling, while the three-month low is $140.20.
As shown in the chart, the upper Bollinger Band is also close overhead. Bollinger Bands plot a moving average with upper and lower boundaries based on recent price variation; their narrowing width can indicate that the market is becoming quieter before a larger move, though it does not reveal which direction that move will take.
Oscillators & Momentum
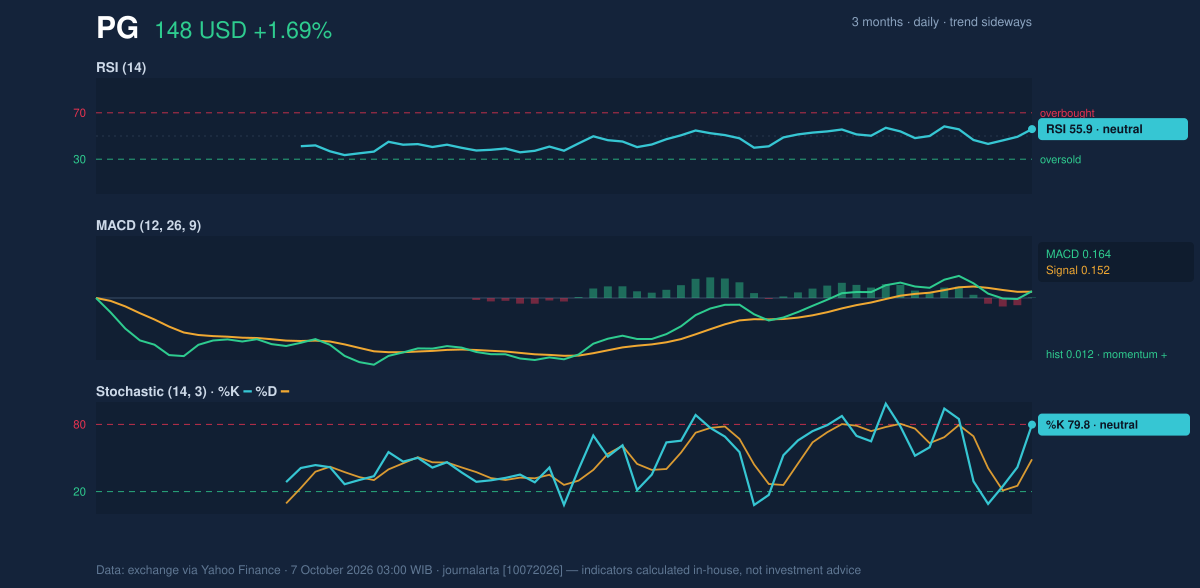
Momentum indicators lean positive without showing a decisive breakout. The Relative Strength Index (RSI), which gauges the speed of recent price changes, is 55.9—neutral rather than stretched. Stochastic %K at 79.8 and %D at 48.8 are also classified as neutral, though the gap between the lines suggests short-term strength is building. Neither oscillator confirms an overbought condition or a durable reversal.
MACD, a trend-and-momentum measure, is slightly positive: its reading of 0.164 is above the 0.152 signal line, leaving a positive histogram of 0.012. That is a modest bullish confirmation, not a strong one. The indicators therefore support the day’s advance but do not erase the sideways pattern.
Volatility, Volume & Key Levels
The Bollinger %B reading of 83% places PG in the upper portion of its band range, with the upper band at $149.60 and the lower band at $142.81. The band width is 4.6% and narrowing, a squeeze that signals compressed volatility and the possibility of expansion. The Average True Range (ATR)—an estimate of typical daily movement—is $2.32, or 1.6% of the share price, consistent with moderate volatility.
Participation strengthened: volume of 13.33 million shares was 1.6 times the 20-session average of 8.31 million, while On-Balance Volume (OBV), a running measure that adds volume on rising days and subtracts it on falling days, is rising. Higher volume and rising OBV give the advance more support than price alone would provide. Still, a single active session cannot establish lasting demand.
Resistance stands at $149.03, with the upper Bollinger Band at $149.60. A sustained move through that area would suggest buyers are overcoming nearby supply; failure there could leave PG contained in its range. Support is $142.64, just below the lower band at $142.81. A break below $142.64 would weaken the recovery and put the three-month low of $140.20 back in focus.
Technical Verdict: HOLD (wait & see)
The indicators support patience rather than a firm directional call. Price remains above both moving averages, MACD is positive, and the volume and OBV readings confirm stronger participation. Against that, the longer pattern is sideways, the 20-day average is still sloping down, and shares are close to resistance. The HOLD verdict is invalidated if price falls below $142.64.
- Ideal Entry Range: $142.81–$146.20, bounded by the lower Bollinger Band and the 20-day SMA.
- Exit Target (Target Price): $149.03–$149.60, the 20-session resistance and upper Bollinger Band.
- Stop Loss: Below $142.64, the 20-session support level.
For non-traders, HOLD means the chart is mixed: the recent rise has support, but price is testing resistance before the trend is clear.
Market Data
| Indicator | Reading |
|---|---|
| Last price | $148.41 |
| Daily change | +1.69% |
| SMA20 / SMA50 | $146.20 / $145.70 |
| Bollinger Bands | Upper $149.60 / Middle $146.20 / Lower $142.81 |
| RSI / Stochastic | 55.9 / %K 79.8, %D 48.8 |
| MACD / Signal | 0.164 / 0.152 |
| ATR | $2.32 |
| Volume / 20-session average | 13,333,600 / 8,307,935 |
| 20-session support / resistance | $142.64 / $149.03 |
| Three-month high / low | $154.32 / $140.20 |
Summary Data PG
| Last price | 148.41 USD |
| Change 1 day / 5 days / 1 month | 1.69% / 0.06% / 1.94% |
| Trend / MA-cross | sideways / none |
| SMA20 / SMA50 | 146.20 / 145.70 |
| RSI (14) / Stochastic %K | 55.9 / 79.8 |
| Bollinger %B / ATR | 83% / 2.32 |
| Support / Resistance 20 days | 142.64 / 149.03 |
| Data as of | 7 October 2026 03:00 WIB |
Track PG stock price daily: live levels, support/resistance and our full PG analysis history.