WMT Stock Gains 2.03%, Momentum Weakens In Focus
On October 6, 2026: price 107.20 USD, trend sideways, RSI 50.2, support 103.92, resistance 110.53. technical analysis of wmt stock. WMT Stock Gains — full…
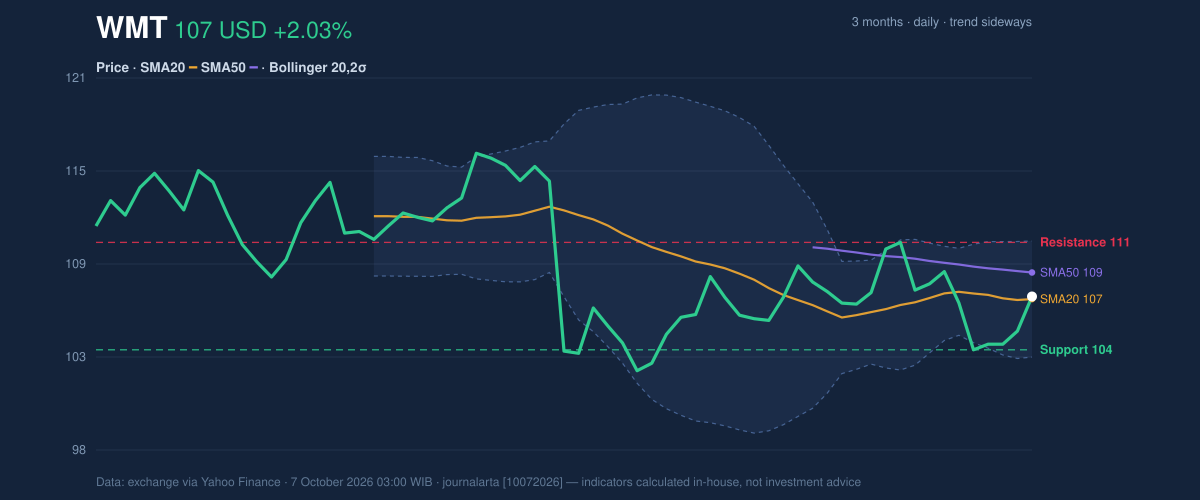
Walmart’s latest 2.03% gain puts the retailer’s shares just above their 20-day average, but the broader signal remains indecisive: price is still below the 50-day average and the MACD indicates negative momentum. For international investors, the tension matters because the stock is trading near the middle of its recent range, not at a level that confirms a sustained breakout or breakdown.
The latest price was $107.20, compared with a previous close of $105.07, according to market data from the exchange via Yahoo Finance as of October 7, 2026, 03:00 WIB. The advance leaves the shares up 0.37% over five trading days and 1.08% over one month. Those modest gains, alongside a sideways trend, suggest that the latest jump has not yet shifted the prevailing pattern.
Trend & Price Action
Walmart is trading above its SMA20, or 20-day simple moving average, at $107.04, but below its SMA50 at $108.67. The shorter average’s slope is down 0.41% over five trading days, and there has been no new moving-average crossover. Together, those readings point to a market that has stabilized near its short-term average without establishing a stronger upward trend.
The shares sit at roughly the midpoint of the 20-trading-day range between support at $103.92 and resistance at $110.53. The wider three-month range, from $102.15 to $118.09, shows that the current price remains well below the period’s high. That context makes the immediate resistance meaningful: a move through it would improve the near-term chart, while failure to hold support would expose the stock to renewed weakness.
As shown in the chart, the price is close to the Bollinger middle band, with the upper and lower bands at $110.61 and $103.47.
Oscillators & Momentum
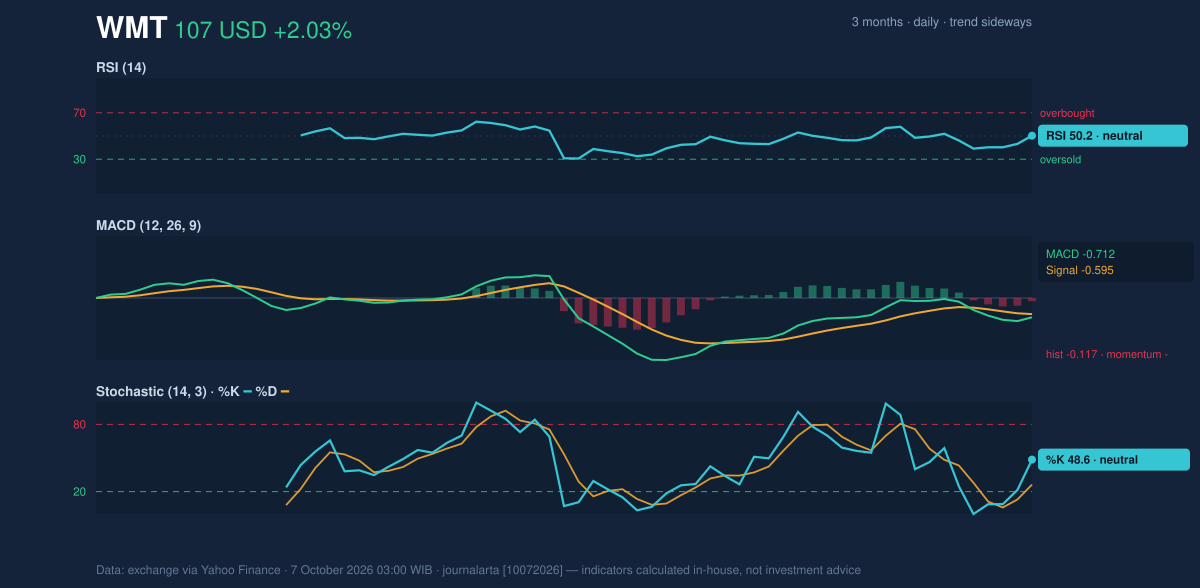
Momentum indicators are mixed rather than confirmatory. The RSI is neutral at 50.2, a reading consistent with neither strong buying pressure nor an oversold condition. The Stochastic is also neutral, with %K at 48.6 and %D at 26.3; the gap between the lines may signal a change in short-term momentum, but it does not by itself establish a durable reversal.
The MACD remains negative, at -0.712 against a signal line of -0.595, while its histogram is -0.117. Because MACD compares shorter- and longer-term price momentum, a reading below its signal line points to lingering downside pressure. The indicator therefore tempers the positive daily move: buyers have lifted the share price, but the momentum measure has not yet turned in their favor.
Volatility & Volume
The Bollinger Band width is 6.7% and narrowing, indicating that recent price fluctuations have contracted. A squeeze can precede a larger move, but it does not predict the direction; traders typically look for a break beyond the band or nearby support and resistance to show which side has gained control. The current %B reading of 52% places the stock slightly above the bands’ midpoint, consistent with its position near the SMA20 rather than an extreme.
Average true range, a measure of typical price movement, is $2.21, or 2.1% of the share price, indicating moderate volatility. Trading volume was 22,017,700 shares, close to the 20-day average of 22,236,570, while on-balance volume (OBV)—a running measure that combines price direction and volume—was rising. That OBV trend suggests participation has been constructive, though volume near its average is not strong evidence of a decisive breakout.
Key Levels & Scenarios
The narrowing bands frame a clear near-term test. A break above $110.53 resistance would also move price toward the upper Bollinger Band at $110.61, strengthening the case that the consolidation is resolving upward. If the stock cannot clear that zone, its midpoint position leaves room for another test of $103.92 support. A break below support would weaken the short-term structure; the lower band at $103.47 is a nearby reference, not a guarantee of a floor.
Technical Verdict: HOLD
HOLD (wait & see) best reflects the conflicting signals: the price is above SMA20 and OBV is rising, but it remains below SMA50 and MACD momentum is negative. The neutral RSI and narrowing Bollinger Bands add evidence of consolidation, not confirmation of direction.
- Indicative entry range: $103.92–$107.04, anchored to 20-day support and SMA20.
- Exit target: $110.53, the 20-day resistance level.
- Stop-loss protection: $103.47, the lower Bollinger Band.
- Invalidation condition: The verdict is invalidated if price falls below $103.92 support.
In plain English, the chart does not yet show whether Walmart’s next sustained move will be up or down.
Summary Data WMT
| Last price | 107.20 USD |
| Change 1 day / 5 days / 1 month | 2.03% / 0.37% / 1.08% |
| Trend / MA-cross | sideways / none |
| SMA20 / SMA50 | 107.04 / 108.67 |
| RSI (14) / Stochastic %K | 50.2 / 48.6 |
| Bollinger %B / ATR | 52% / 2.21 |
| Support / Resistance 20 days | 103.92 / 110.53 |
| Data as of | 7 October 2026 03:00 WIB |
Track WMT stock price daily: live levels, support/resistance and our full WMT analysis history.