Testing Key Resistance, CCB Stock Gains 1.80% on Monday
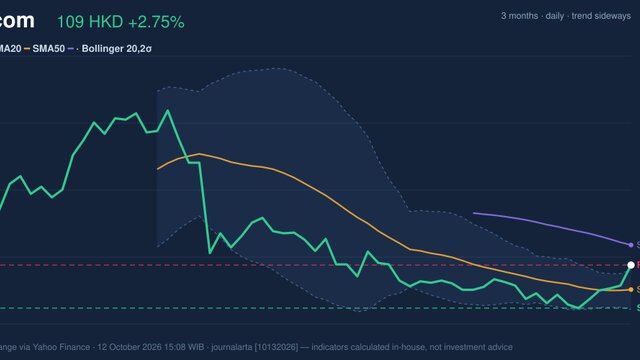
On October 12, 2026: price 9.91 HKD, trend sideways, RSI 62.3, support 9.51, resistance 9.91. technical analysis of ccb stock. Testing Key Resistance — full…
Why CCB is in focus today
- Closed at a 20-day high (9.91)
- Trading near its 3-month high (9.93)
- Breaking out of a Bollinger squeeze (band width 4.3%)
- Not covered by JournalArta in the last 14 days
Selected automatically from 16 HKEX (Hong Kong) stocks by a technical-signal score with daily weighted randomisation — not a recommendation.
Trend & Price Action
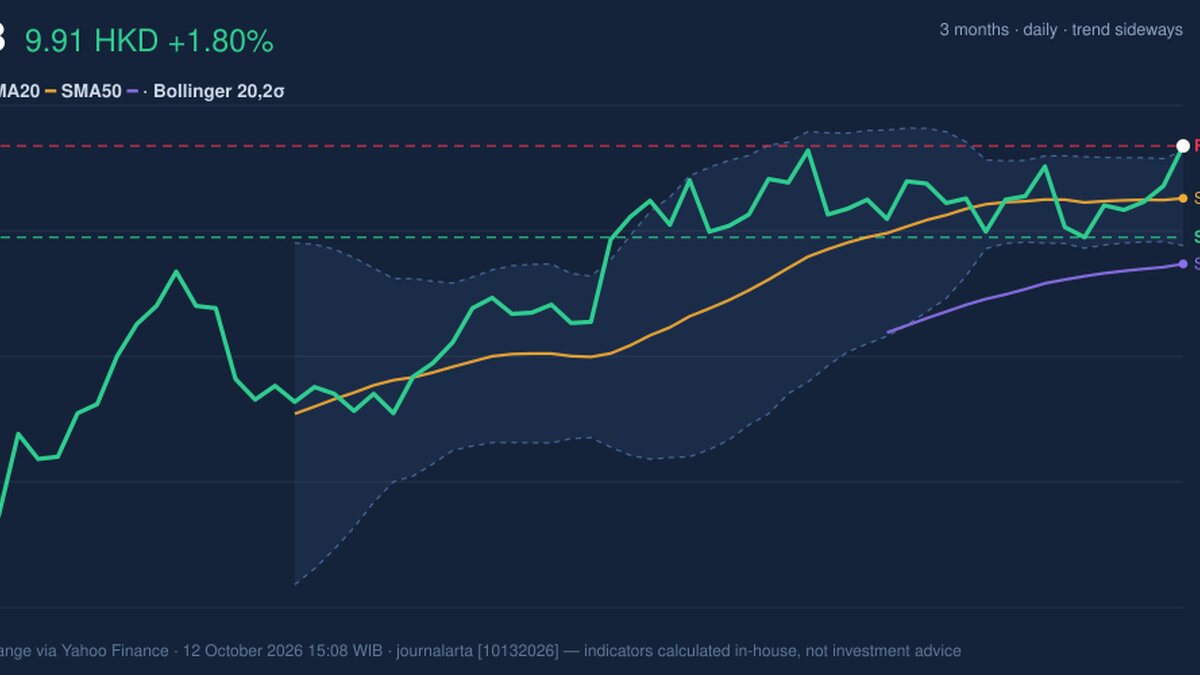
CCB closed at HK$9.91, up 1.80% on the day and 4.21% over five days, according to market data from the exchange via Yahoo Finance dated October 12, 2026. The price sits above its 20-day average of HK$9.68 and 50-day average of HK$9.39, while the 20-day average has a gently positive slope. That alignment supports the near-term advance, though no new moving-average crossover has formed; the trend remains classified as sideways rather than a confirmed broader uptrend. The shares also finished at the top of their 20-day range and are close to the three-month high of HK$9.93. This places the stock at a decision point: a move beyond the recent ceiling would strengthen the breakout case, while failure to hold near the range top could signal that buyers have not yet established a higher trading band. The price is above both moving averages, but the absence of a fresh crossover limits the strength of the trend confirmation. The Bollinger Band width narrowed to 4.3% before the price moved above the upper band at HK$9.89, with %B at 105%. Bollinger Bands measure how far a price has moved relative to its recent trading range; a squeeze can precede a larger move, but a close beyond the upper band can also mean the short-term advance is stretched. The squeeze has resolved upward, although trading above the upper band raises the risk of a near-term pullback.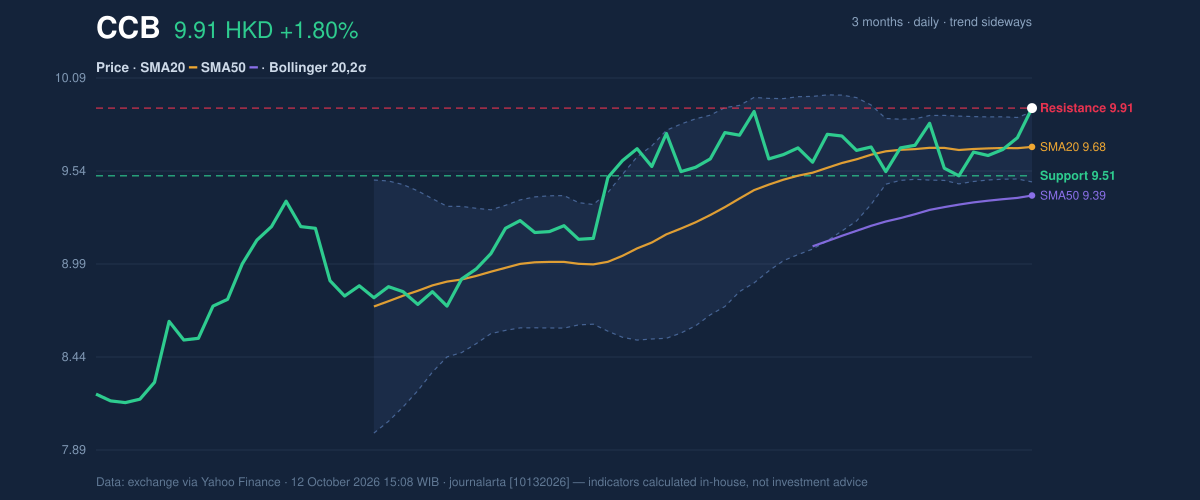
Oscillators & Momentum
The momentum picture is mixed. RSI, a measure of recent gains relative to losses, stands at 62.3, in neutral territory, suggesting positive momentum without an extreme reading. Stochastic %K at 95.8 and %D at 73.3, however, put the faster oscillator in overbought territory. That can occur during a strong advance, but it also indicates that the latest rise has been rapid and may need consolidation. MACD, which compares shorter- and longer-term price momentum, is less supportive: the MACD reading of 0.087 is below its 0.093 signal line, leaving a slightly negative histogram of -0.006. Stochastic is overbought while MACD momentum is marginally negative, so the rally lacks full confirmation across indicators. The readings do not negate the price strength, but they make follow-through important.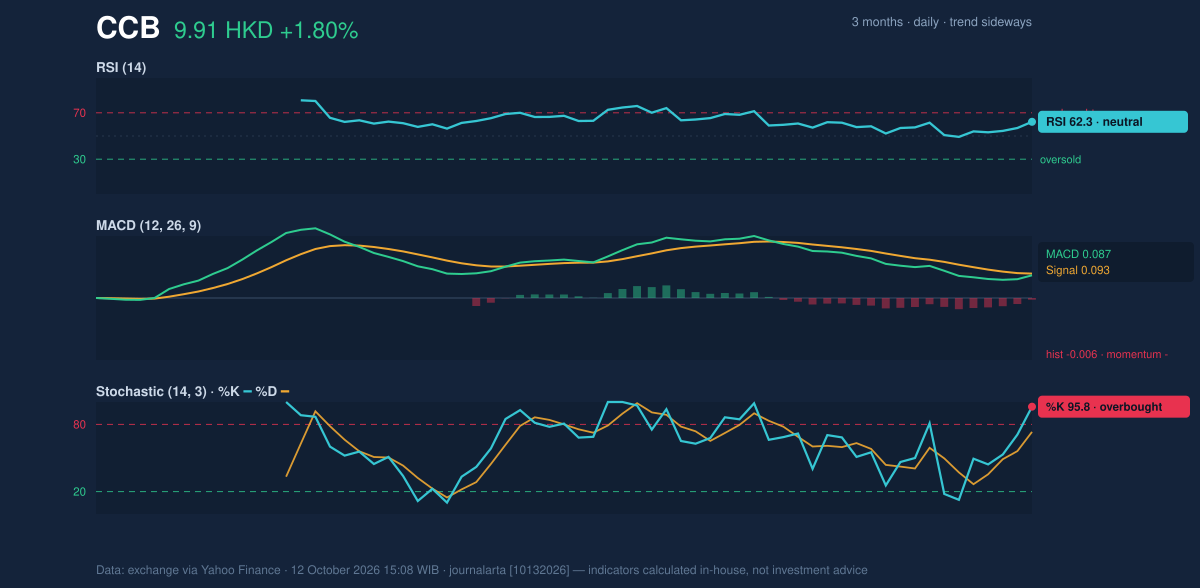
Volatility, Volume & Key Levels
Average true range, a gauge of typical price movement, is HK$0.18, or 1.8% of the share price, indicating moderate volatility. Volume was 150.0 million shares, below the 20-day average of 163.7 million, at about 0.9 times normal. On-balance volume, which tracks whether volume is accumulating on rising or falling sessions, is rising. That offers some evidence of buying participation, but the below-average turnover makes the latest move less emphatic than a high-volume breakout. The immediate resistance is HK$9.91, with the three-month high at HK$9.93. A sustained move through that area would put the recent ceiling behind the price; a rejection would leave the shares exposed to the 20-day support at HK$9.51. Below that, the 20-day moving average at HK$9.68 and the lower Bollinger Band at HK$9.47 provide further reference points. The moving average is currently above the stated 20-day support, so a retreat through HK$9.51 would be a meaningful weakening of the immediate structure.Technical Verdict: HOLD
HOLD (wait & see) reflects a strong position above both moving averages and an upward resolution from a Bollinger squeeze, balanced against an overbought Stochastic reading, slightly negative MACD histogram and below-average volume. The verdict is invalidated if the price falls below HK$9.51, the 20-day support.- Indicative entry range: HK$9.51–HK$9.68, around 20-day support and the 20-day moving average.
- Indicative exit target: HK$9.93, the three-month high and nearby resistance.
- Indicative stop-loss protection: below HK$9.47, the lower Bollinger Band.
Summary Data CCB
| Last price | 9.91 HKD |
| Change 1 day / 5 days / 1 month | 1.80% / 4.21% / 1.64% |
| Trend / MA-cross | sideways / none |
| SMA20 / SMA50 | 9.68 / 9.39 |
| RSI (14) / Stochastic %K | 62.3 / 95.8 |
| Bollinger %B / ATR | 105% / 0.18 |
| Support / Resistance 20 days | 9.51 / 9.91 |
| Data as of | 12 October 2026 15:08 WIB |
Disclaimer: This technical analysis is generated automatically from exchange data (via Yahoo Finance) and indicators calculated by JournalArta, for information and education only. The verdict and the entry, target and stop-loss levels are not investment advice or a solicitation to buy or sell any security. Investment decisions and their risks rest solely with the reader.
Track CCB share price daily: live levels, support/resistance and our full CCB analysis history.