GOOGL Stock Technicals: Gains 0.30% on Tuesday, Golden Cross Formed
On October 13, 2026: price 353.78 USD, trend uptrend, RSI 57.8, support 337.83, resistance 354.97. technical analysis of googl stock. GOOGL Stock Technicals —…
Why GOOGL is in focus today
- Fresh golden cross: SMA20 crossed above SMA50
- Uptrend confirmed (5-day change 1.75%)
- Not covered by JournalArta in the last 14 days
Selected automatically from 32 NASDAQ (US) stocks by a technical-signal score with daily weighted randomisation — not a recommendation.
Trend & Price Action
The stock is in an uptrend, with its 20-day simple moving average (SMA) rising 0.89% over five trading days. The SMA is the average closing price over a set period, used to smooth daily fluctuations. GOOGL sits above its 20-day SMA of $346.53 and its 50-day SMA of $345.79. The 20-day average has crossed above the 50-day average, a pattern known as a golden cross. It can signal improving short-term momentum, though it does not guarantee that gains will continue. There is a near-term test ahead: the last price is close to the $354.97 resistance identified over the past 20 trading days. The shares are at 93% of their 20-day range, while the three-month high of $384.48 remains well above the current price. That positioning leaves limited room to the nearby resistance before a breakout would need to be confirmed.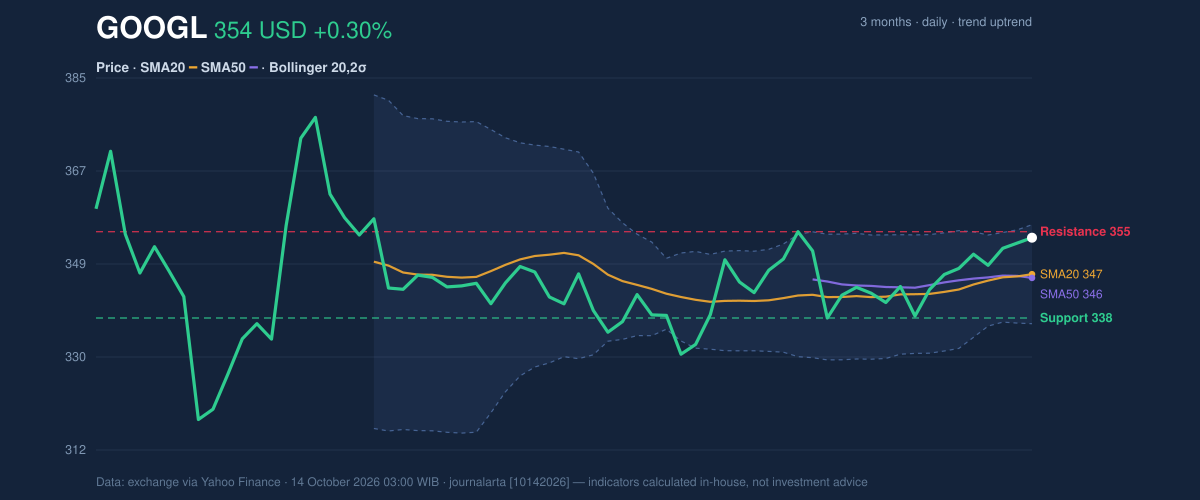
Momentum & Volatility
Momentum indicators are positive but not uniformly forceful. The MACD is positive, at 2.044 against a signal line of 0.893, with a positive histogram of 1.151. MACD compares moving averages to gauge the direction and strength of momentum; its current configuration supports the uptrend. The RSI is neutral at 57.8, while the Stochastic is also classed as neutral, with %K at 79.2 and %D at 72.1. These readings suggest strength without an indicator-based confirmation that the stock is broadly overbought.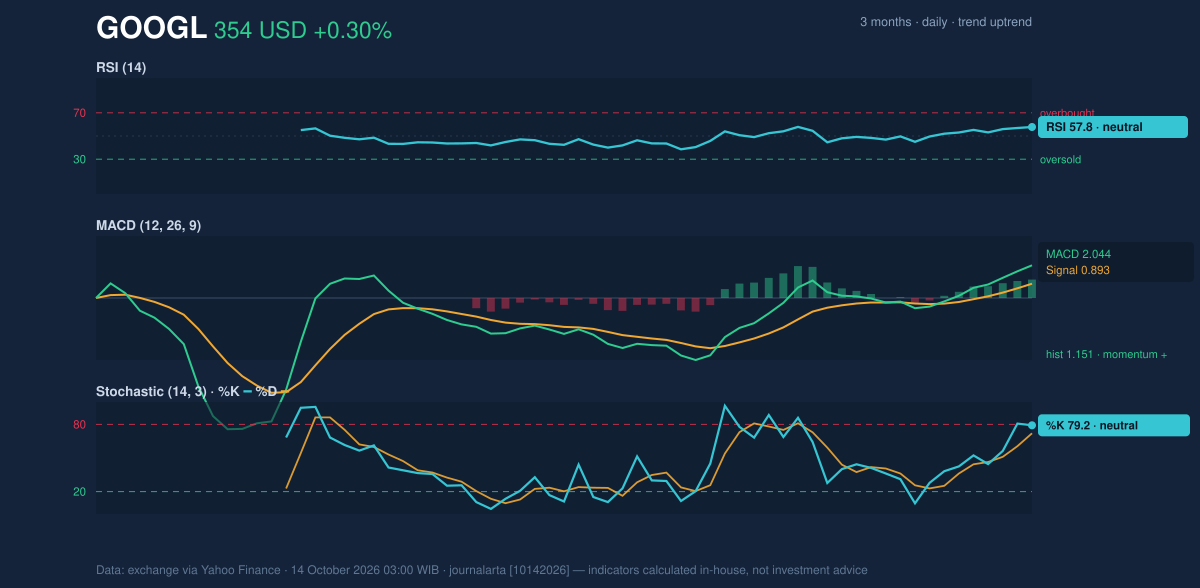
Key Levels & Scenarios
The immediate decision point is $354.97. A sustained move above it would put the upper Bollinger band at $356.35 in focus, while a failure at resistance could leave the shares testing the nearby moving averages. The first significant downside reference is $337.83 support from the past 20 trading days; the lower Bollinger band at $336.70 is close to that level. A break below support would weaken the current technical structure. The three-month low of $314.90 provides broader context, not an immediate trading floor.Technical Verdict: HOLD (wait & see)
The indicators lean positive, but the shares are pressing against resistance and the latest volume is below average. The golden cross and rising SMA20 support the trend; positive MACD confirms momentum; and rising OBV offers participation support. Against that, the price is already near the upper Bollinger band and 20-day resistance, leaving confirmation of a breakout pending. Core reading: the trend is constructive, but resistance and subdued volume make confirmation the missing piece. - Indicative entry range: $346.53–$354.97, bounded by the 20-day SMA and 20-day resistance. - Indicative exit target: $356.35, the upper Bollinger band. - Indicative stop-loss protection: $336.70, the lower Bollinger band, just below 20-day support. - Invalidation: The HOLD assessment is invalidated if price breaks below $337.83 support. For non-traders, the chart points to an improving trend, but the stock has yet to show that it can push convincingly through nearby resistance.| Indicator | Reading |
|---|---|
| Last price | $353.78 |
| Daily / five-day change | +0.30% / +1.75% |
| SMA20 / SMA50 | $346.53 / $345.79 |
| MA cross | Golden cross |
| Bollinger bands | $336.70 / $346.53 / $356.35 |
| RSI / Stochastic | 57.8 / %K 79.2, %D 72.1 |
| MACD / signal / histogram | 2.044 / 0.893 / 1.151 |
| ATR | $7.62 (2.2%) |
| Volume / 20-session average | 23,148,200 / 25,517,630 |
| 20-day support / resistance | $337.83 / $354.97 |
| Three-month high / low | $384.48 / $314.90 |
Summary Data GOOGL
| Last price | 353.78 USD |
| Change 1 day / 5 days / 1 month | 0.30% / 1.75% / 2.55% |
| Trend / MA-cross | uptrend / golden |
| SMA20 / SMA50 | 346.53 / 345.79 |
| RSI (14) / Stochastic %K | 57.8 / 79.2 |
| Bollinger %B / ATR | 87% / 7.62 |
| Support / Resistance 20 days | 337.83 / 354.97 |
| Data as of | 14 October 2026 03:00 WIB |
Disclaimer: This technical analysis is generated automatically from exchange data (via Yahoo Finance) and indicators calculated by JournalArta, for information and education only. The verdict and the entry, target and stop-loss levels are not investment advice or a solicitation to buy or sell any security. Investment decisions and their risks rest solely with the reader.
Track GOOGL stock price daily: live levels, support/resistance and our full GOOGL analysis history.