On October 13, 2026: price 102.81 USD, trend sideways, RSI 42.1, support 101.05, resistance 127.39. technical analysis of intc stock. INTC Stock Gains — full…
By Elena Vance
October 14, 20264 min read
INTC Stock Gains 1.44%, Momentum Weakens In Focus
Intel shares rose 1.44% to $102.81 on Tuesday, but remain sharply lower over the past five trading days, leaving the chipmaker at a technically fragile point that matters to investors tracking the US semiconductor sector. The stock’s position near the bottom of its recent range, together with mixed momentum signals, suggests the daily gain has yet to confirm a broader recovery.
Trend & Price Action
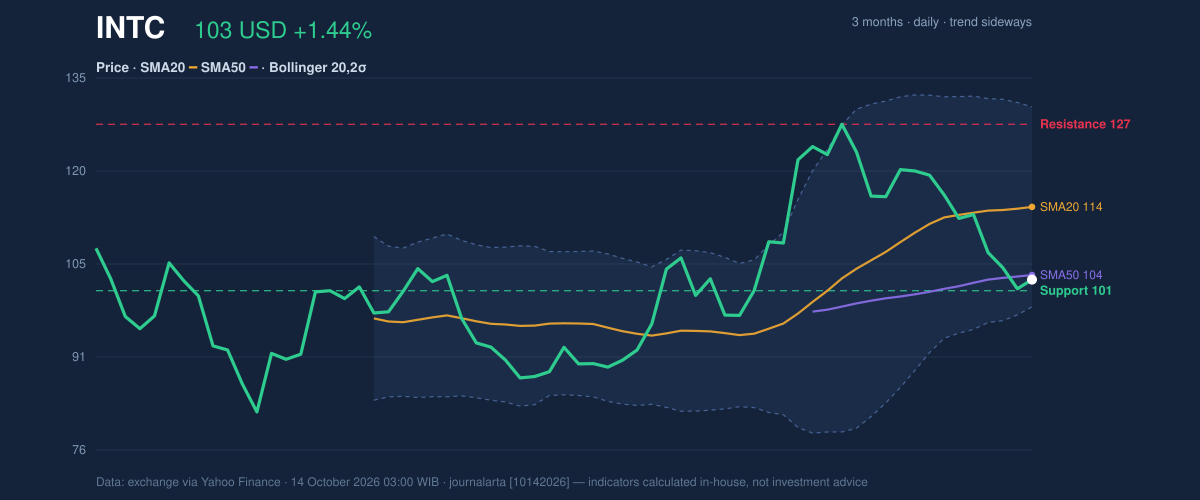
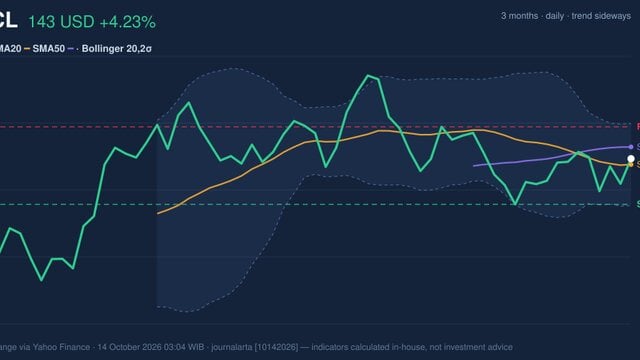
Intel’s latest price is below both its 20-day simple moving average, or SMA, at $114.32 and its 50-day average at $103.54. These averages smooth daily price swings to show the prevailing direction; the price’s position beneath them indicates that recent trading remains weak, even as the 20-day average has a modest upward slope. There has been no new crossover between the averages, so the data does not show a fresh trend-change signal.
The stock is down 8.61% over five days but up 5.84% over a month, a split that points to a recent pullback within a broader period of gains rather than a clear, sustained direction. At $102.81, Intel sits near the lower end of its 20-trading-day range, which spans support at $101.05 to resistance at $127.39. It is also above its three-month low of $81.79, though well below the period high of $127.44.
The $101.05 support is the immediate test: holding it could stabilize the near-term structure, while a break below would weaken the case that the recent pullback is finding a floor.3-month price action chart of INTC: price, SMA20/50, Bollinger, support & resistance. Data: exchange via Yahoo Finance.
Oscillators & Momentum
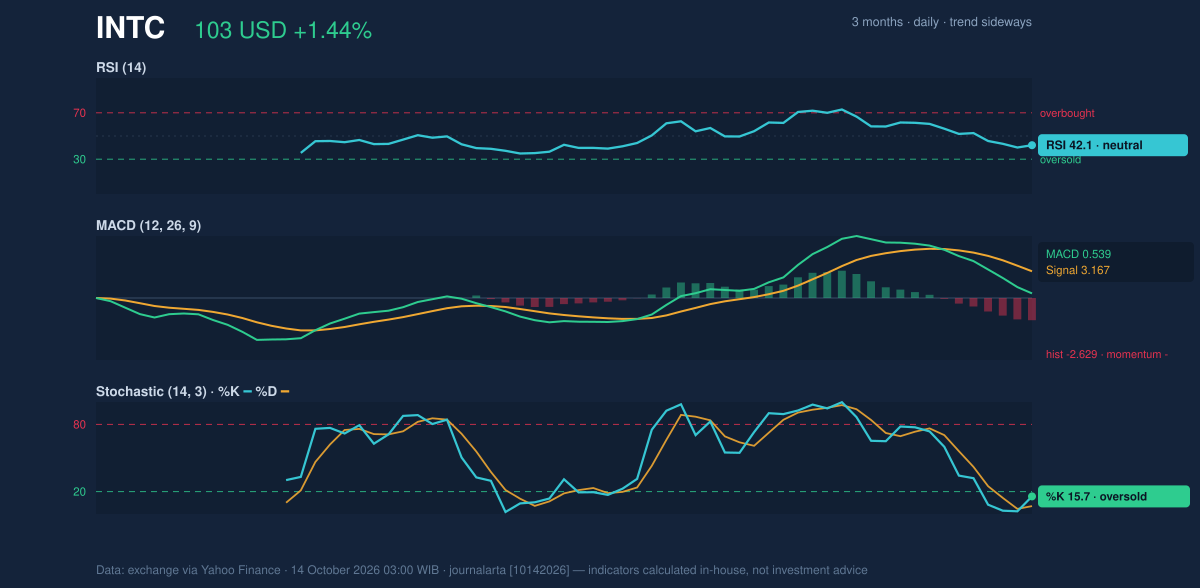
Momentum readings do not yet confirm a rebound. The relative strength index, or RSI, is 42.1, a neutral reading that suggests neither strong buying pressure nor an extreme oversold condition. The Stochastic oscillator is more stretched: its %K is 15.7 and %D is 7.0, readings commonly associated with oversold conditions. That may indicate selling has become intense, but it is not, by itself, evidence that prices have turned higher.
The MACD indicator reinforces the caution. Its value of 0.539 is below its signal line at 3.167, while the histogram is negative at -2.629. In plain terms, the shorter-term momentum measure is lagging its comparison line, consistent with the recent five-day decline. Stochastic is oversold, but MACD momentum remains negative and RSI is neutral—not a synchronized reversal signal.Momentum chart of INTC: RSI(14), MACD, Stochastic. Data: exchange via Yahoo Finance.
Volatility & Volume
Intel’s Bollinger Bands are widening, with a band width of 27.7%, a sign that price swings have become larger rather than compressed. The stock’s %B reading is 14%, placing it close to the lower band at $98.49; the middle band is $114.32 and the upper band is $130.14. This combination says downside pressure has pushed the price toward the lower edge of its recent statistical range, but wider bands also warn that volatility can remain elevated.
Average true range, a measure of typical daily movement, is $5.52, or 5.4% of the share price. Trading volume was 87,718,300 shares, about 0.8 times the 20-day average, while on-balance volume, which tracks whether trading volume tends to accompany rising or falling prices, is declining. The latest rise therefore came on below-average activity and without confirmation from the volume trend. Widening bands and falling OBV point to high volatility without convincing accumulation.
Key Levels & Scenarios
The first nearby reference is $101.05 support, with the lower Bollinger Band at $98.49 offering another level to monitor if support gives way. A sustained move back above the $103.54 50-day average would improve the short-term picture, but the more substantial hurdle is the $114.32 20-day average. Beyond that, the 20-day resistance at $127.39 aligns closely with the three-month high of $127.44.
A break above $114.32 would be a stronger sign of repair; failure to hold $101.05 would expose the lower band at $98.49. These are conditional reference points, not predictions: the current volatility readings mean price can move quickly between levels.
Technical Verdict: HOLD
HOLD (wait & see) fits the mixed evidence: price remains below both moving averages, MACD momentum is negative and OBV is falling, while the oversold Stochastic reading and proximity to support leave room for stabilization. The verdict is invalidated if price falls below the $101.05 support.
Ideal Entry Range: $101.05–$103.54, around the 20-day support and 50-day average.
Exit Target (Target Price): $114.32, the 20-day average and Bollinger middle band.
Stop Loss: $98.49, the lower Bollinger Band.
For non-traders, HOLD means the chart has not yet shown enough agreement among trend, momentum and volume to settle whether the decline has ended.
Data source: exchange data via Yahoo Finance, as of 14 October 2026 at 03:00 WIB.
Summary Data INTC
Last price
102.81 USD
Change 1 day / 5 days / 1 month
1.44% / -8.61% / 5.84%
Trend / MA-cross
sideways / none
SMA20 / SMA50
114.32 / 103.54
RSI (14) / Stochastic %K
42.1 / 15.7
Bollinger %B / ATR
14% / 5.52
Support / Resistance 20 days
101.05 / 127.39
Data as of
14 October 2026 03:00 WIB
Disclaimer: This technical analysis is generated automatically from exchange data (via Yahoo Finance) and indicators calculated by JournalArta, for information and education only. The verdict and the entry, target and stop-loss levels are not investment advice or a solicitation to buy or sell any security. Investment decisions and their risks rest solely with the reader.