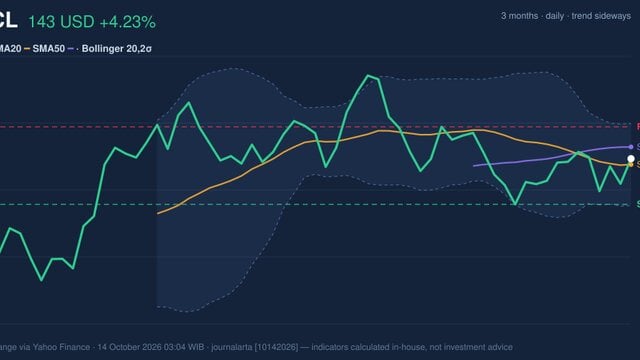
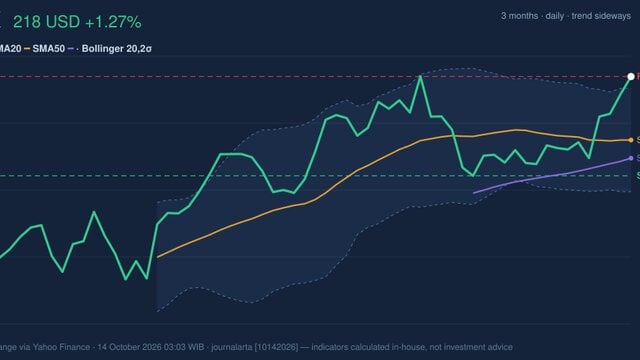
On October 13, 2026: price 953.19 USD, trend sideways, RSI 40.1, support 926.55, resistance 1,097.39. technical analysis of mu stock. Momentum Weakens — full…
By matthew jonathan
October 14, 20264 min read
Momentum Weakens, MU Stock Drops 3.62% on Tuesday
Micron Technology’s shares fell 3.62% to $953.19 on Oct. 14, putting the memory-chip maker near the lower edge of its recent trading range as short-term momentum weakened. The stock is worth watching because JournalArta has not covered it in the past 14 days, while the latest market data show a sharp five-day decline alongside an oversold stochastic reading—a tension between selling pressure and the possibility of a pause.
Data from the exchange via Yahoo Finance showed Micron down 8.83% over five trading days, despite remaining up 2.76% over one month. The latest close was below both its 20-day and 50-day moving averages, commonly used measures of recent price trends. That positioning suggests the near-term balance has shifted against the shares, even as the broader trend remains classified as sideways rather than decisively downward.
There is a warning in the volume, too. Trading reached 29,017,300 shares, about 1.1 times the 20-day average, while on-balance volume (OBV)—a measure that tracks whether volume tends to accompany rising or falling prices—was declining. The combination indicates that the latest drop drew somewhat stronger-than-usual participation, rather than occurring on unusually quiet trading.
Trend & Price Action
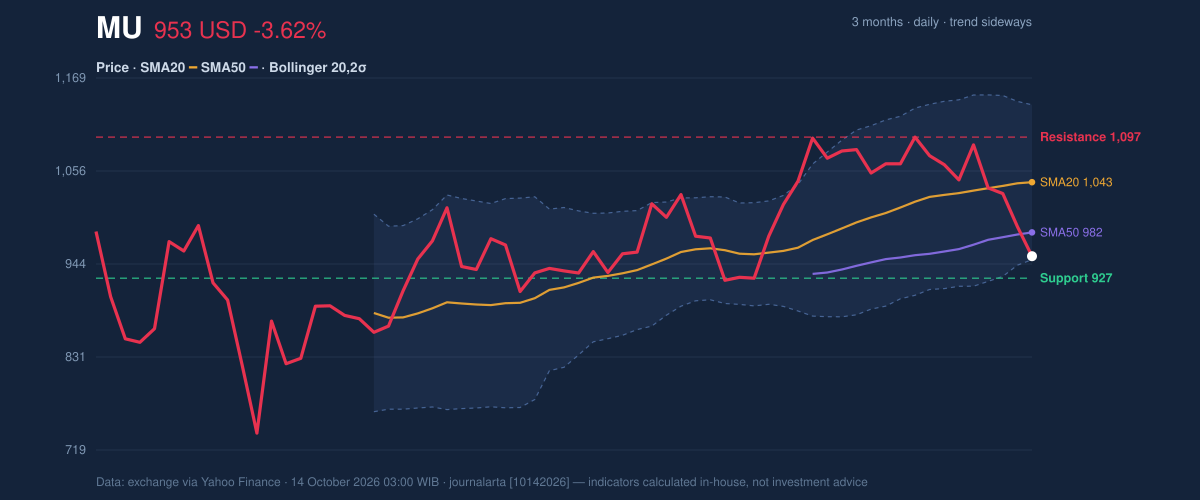
Micron’s price sits below its SMA20 of $1,042.78 and SMA50 of $981.98, while no new crossover between the averages has formed. The 20-day average’s slope is still positive, up 1.28% over five days, but the share price has fallen beneath it. That divergence suggests the longer short-term average has not yet turned down, even as recent trading has deteriorated.
At $953.19, the stock is only 16% of the way up its 20-day range, between support at $926.55 and resistance at $1,097.39. It is also close to the Bollinger lower band at $949.01. Bollinger bands plot a moving average with upper and lower boundaries based on price variation; trading near the lower band shows recent weakness, but does not by itself confirm a reversal.
3-month price action chart of MU: price, SMA20/50, Bollinger, support & resistance. Data: exchange via Yahoo Finance.
The three-month range remains wide, with a high of $1,108.72 and a low of $737.88. That breadth, together with an average true range of $44.12—about 4.6% of the latest price—means daily swings are substantial. A move toward support could therefore be sharp; a recovery would also need to contend with the moving averages overhead.
Oscillators & Momentum
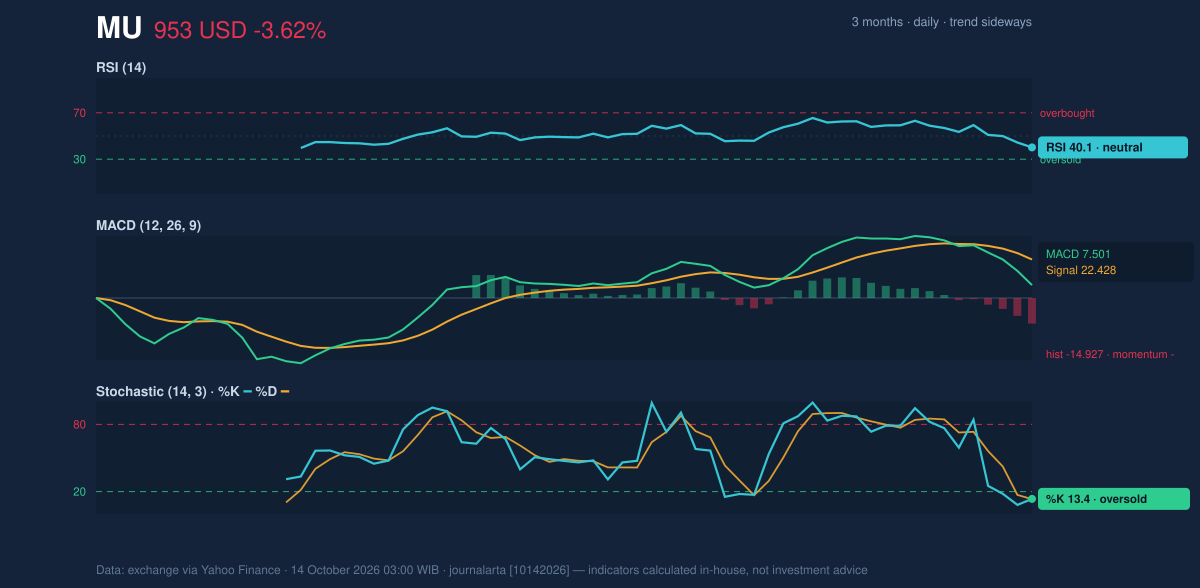
The momentum readings are mixed, but lean negative. The RSI is 40.1, a neutral reading on a scale used to gauge the speed of price moves. It is not yet signaling an oversold condition, so the recent decline has not pushed every momentum measure to an extreme.
By contrast, the stochastic is oversold, with %K at 13.4 and %D at 13.2. This indicator compares a closing price with its recent trading range; a low reading can point to intense selling, but it is not proof that prices have bottomed. The MACD histogram is negative at -14.927, with MACD at 7.501 below its 22.428 signal line. That configuration indicates weakening momentum and argues against treating the oversold stochastic alone as a confirmed rebound signal.
Momentum chart of MU: RSI(14), MACD, Stochastic. Data: exchange via Yahoo Finance.
Volatility, Volume & Scenarios
The Bollinger band width is 18.0%, described as normal rather than unusually compressed. That means the current setup is not a classic quiet-market squeeze that often precedes a sharp expansion in movement. Instead, the elevated ATR and falling OBV point to active price swings and selling participation.
The immediate test is $926.55 support, close to the lower Bollinger band. If the price holds there and momentum stabilizes, the first technical hurdle is the $981.98 SMA50, followed by the $1,042.78 SMA20. A failure to hold support would weaken the range-bound interpretation; a move above the moving averages would be needed to show that the recent slide is losing force.
Technical Verdict: HOLD (wait & see)
The technical evidence supports a neutral, wait-and-see verdict rather than a directional call. The price is below both moving averages, the MACD histogram is negative, and OBV is declining; against that, the stochastic is oversold and the price is close to defined support. The central signal is a weak short-term trend without a confirmed breakdown or reversal.
- Ideal entry range: $926.55–$949.01, around 20-day support and the lower Bollinger band, conditional on support holding.
- Exit target: $981.98, the SMA50 resistance area.
- Stop-loss protection: Below $926.55, the stated 20-day support.
- Invalidation: The verdict is invalidated if the price breaks below $926.55.
For non-traders, the shares are near a support test, but the available signals do not yet show whether the decline is ending.
Data Table
Indicator
Reading
Last price
$953.19
Daily / five-day change
-3.62% / -8.83%
Monthly change
+2.76%
SMA20 / SMA50
$1,042.78 / $981.98
RSI / Stochastic
40.1 / 13.4 (%K), 13.2 (%D)
MACD / signal / histogram
7.501 / 22.428 / -14.927
Support / resistance
$926.55 / $1,097.39
Source and timestamp
Exchange data via Yahoo Finance, Oct. 14, 2026, 03:00 WIB
Summary Data MU
Last price
953.19 USD
Change 1 day / 5 days / 1 month
-3.62% / -8.83% / 2.76%
Trend / MA-cross
sideways / none
SMA20 / SMA50
1,042.78 / 981.98
RSI (14) / Stochastic %K
40.1 / 13.4
Bollinger %B / ATR
2% / 44.12
Support / Resistance 20 days
926.55 / 1,097.39
Data as of
14 October 2026 03:00 WIB
Disclaimer: This technical analysis is generated automatically from exchange data (via Yahoo Finance) and indicators calculated by JournalArta, for information and education only. The verdict and the entry, target and stop-loss levels are not investment advice or a solicitation to buy or sell any security. Investment decisions and their risks rest solely with the reader.