Testing Key Resistance, AAPL Stock Gains 0.09% on Tuesday
On October 13, 2026: price 341.27 USD, trend uptrend, RSI 60.6, support 329.40, resistance 341.27. technical analysis of aapl stock. Testing Key Resistance —…
Why AAPL is in focus today
- Closed at a 20-day high (341.27)
- Trading near its 3-month high (348.15)
- MACD histogram has just turned positive
- Uptrend confirmed (5-day change 2.29%)
- Not covered by JournalArta in the last 14 days
Selected automatically from 32 NASDAQ (US) stocks by a technical-signal score with daily weighted randomisation — not a recommendation.
Trend & Price Action
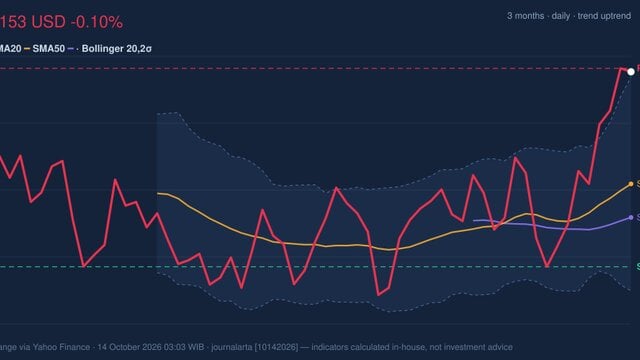
Apple traded above its 20-day simple moving average (SMA) of $336.28 and its 50-day SMA of $323.79. A simple moving average smooths daily price changes to show the broader direction; with the shorter average above the longer one and the share price above both, the price structure favors the upside. The 20-day average’s slope is positive, rising 0.86% over five days. There has been no new moving-average crossover, however, so the trend signal comes from the existing price position rather than a fresh technical trigger. The stock is at the top of its 20-trading-day range and near its three-month high of $348.15, with the period low at $300.00. That proximity gives the current advance room to test the broader high, but it also places more weight on whether price can hold near the range ceiling. As shown in the chart, price is approaching the upper Bollinger Band at $343.29, while the lower band is $329.27. Bollinger Bands measure how far prices are moving around their average: the current band width of 4.2% is narrowing, a squeeze that can precede a larger move but does not, by itself, predict its direction. The %B reading of 86% places the price near the upper band, consistent with strength but also leaving less distance before that boundary.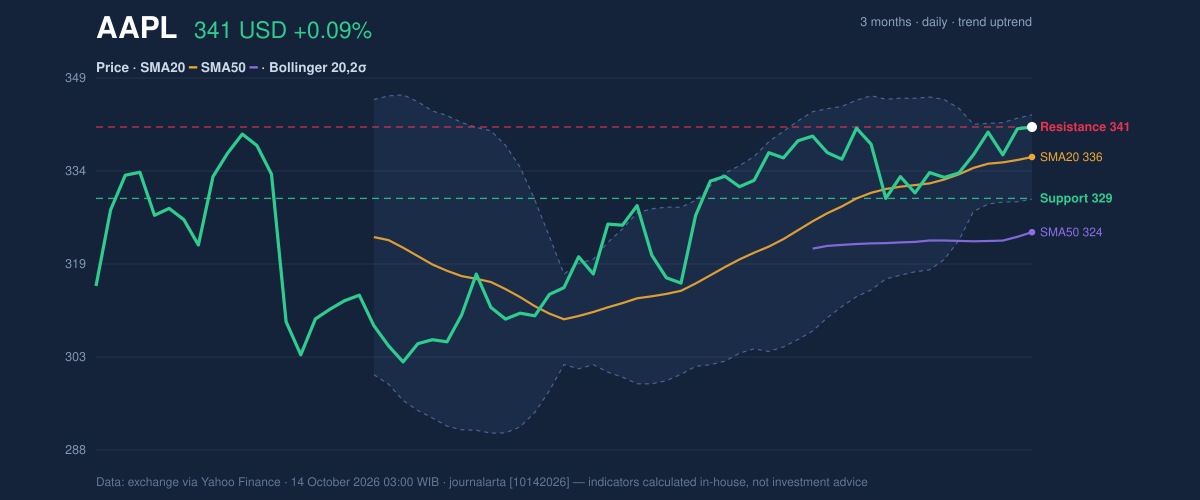
Oscillators & Momentum
Momentum indicators are positive, though not uniformly forceful. The RSI is 60.6, a neutral reading, rather than an extreme level that would signal a clearly overbought or oversold market. RSI compares recent gains with losses; here, it supports a firm tone without indicating that the advance has become unusually stretched. The Stochastic reading is also neutral, with %K at 69.2 and %D at 71.0. Because %K is slightly below %D, the indicator is not giving a clean short-term acceleration signal. The MACD offers a more constructive clue: its histogram has just turned positive at 0.009, with the MACD at 3.697 and signal line at 3.687. MACD compares two smoothed price trends, and a positive histogram means the faster measure has edged above the slower one. The gap is narrow, so this is an early shift in momentum rather than a wide separation.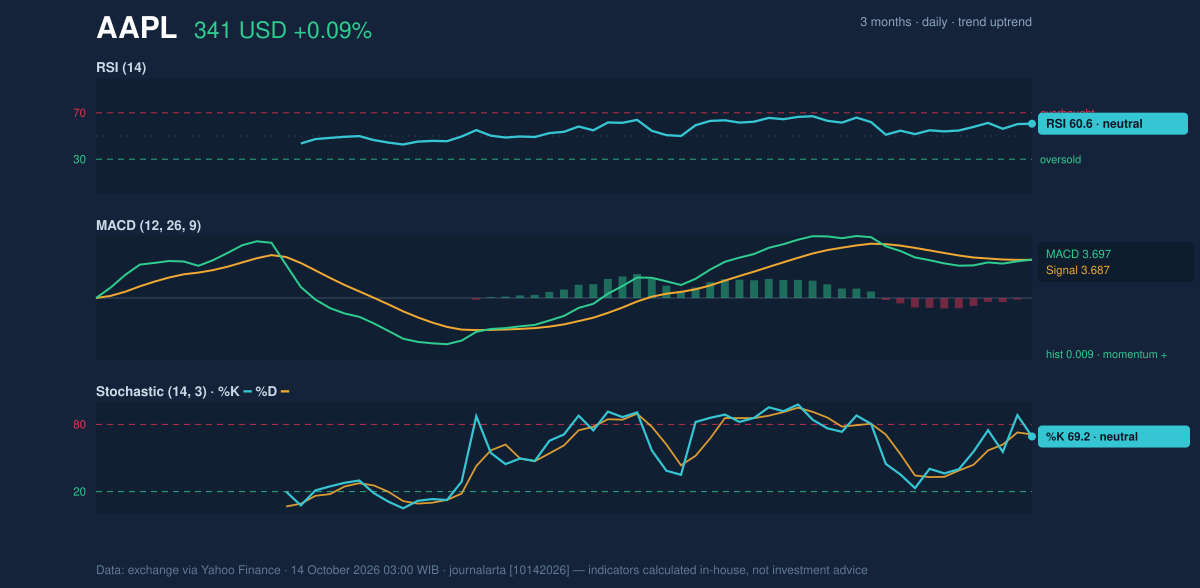
Volatility, Volume & Key Levels
Average True Range (ATR), a measure of typical daily price movement, is $6.50, or 1.9% of the share price, indicating moderate volatility in this data set. Trading volume was 38,946,900 shares, about 1.0 times the 20-day average of 37,465,300. The move therefore came with ordinary participation rather than a pronounced surge. On-balance volume (OBV), which tracks whether volume is associated with rising or falling prices, is increasing and adds support to the advance. The main near-term test is resistance at $341.27, the stated 20-day ceiling and the current close. A move above it would put the $343.29 upper Bollinger Band and then the $348.15 three-month high in focus. Failure to hold above the $329.40 support would weaken the short-term structure; the $329.27 lower Bollinger Band is nearby, while the 20-day SMA at $336.28 is an earlier reference within that range.Technical Verdict: HOLD (wait & see)
The indicators lean positive, but the price is at the 20-day range ceiling and the upper Bollinger Band is close. The MACD histogram has only just turned positive, while the Stochastic is neutral and volume is near its usual level. Together, those signals favor waiting for stronger confirmation rather than treating the current position as a decisive breakout. The verdict is invalidated if price falls below $329.40, the stated 20-day support.- Ideal entry range: $329.40–$336.28, spanning 20-day support and the 20-day SMA.
- Exit target: $348.15, the three-month high.
- Stop-loss protection: Below $329.27, the lower Bollinger Band.
| Indicator | Reading |
|---|---|
| Last price | $341.27 |
| Daily / five-day / one-month change | +0.09% / +2.29% / +3.00% |
| SMA20 / SMA50 | $336.28 / $323.79 |
| Bollinger Bands (upper / middle / lower) | $343.29 / $336.28 / $329.27 |
| RSI / Stochastic %K, %D | 60.6 / 69.2, 71.0 |
| MACD / signal / histogram | 3.697 / 3.687 / 0.009 |
| ATR / volume / OBV | $6.50 / 38,946,900 / rising |
| 20-day support / resistance | $329.40 / $341.27 |
| Three-month high / low | $348.15 / $300.00 |
Summary Data AAPL
| Last price | 341.27 USD |
| Change 1 day / 5 days / 1 month | 0.09% / 2.29% / 3.00% |
| Trend / MA-cross | uptrend / none |
| SMA20 / SMA50 | 336.28 / 323.79 |
| RSI (14) / Stochastic %K | 60.6 / 69.2 |
| Bollinger %B / ATR | 86% / 6.50 |
| Support / Resistance 20 days | 329.40 / 341.27 |
| Data as of | 14 October 2026 03:00 WIB |
Disclaimer: This technical analysis is generated automatically from exchange data (via Yahoo Finance) and indicators calculated by JournalArta, for information and education only. The verdict and the entry, target and stop-loss levels are not investment advice or a solicitation to buy or sell any security. Investment decisions and their risks rest solely with the reader.
Track AAPL stock price daily: live levels, support/resistance and our full AAPL analysis history.