Testing Key Resistance, UNH Stock Drops 0.20% on Tuesday
On October 13, 2026: price 377.76 USD, trend sideways, RSI 47.8, support 365.20, resistance 379.30. technical analysis of unh stock. Testing Key Resistance —…
Trend & Price Action
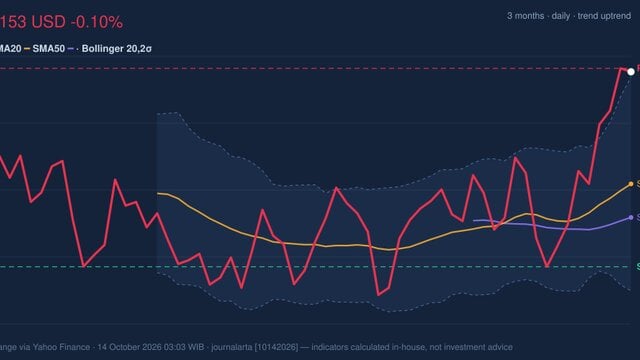
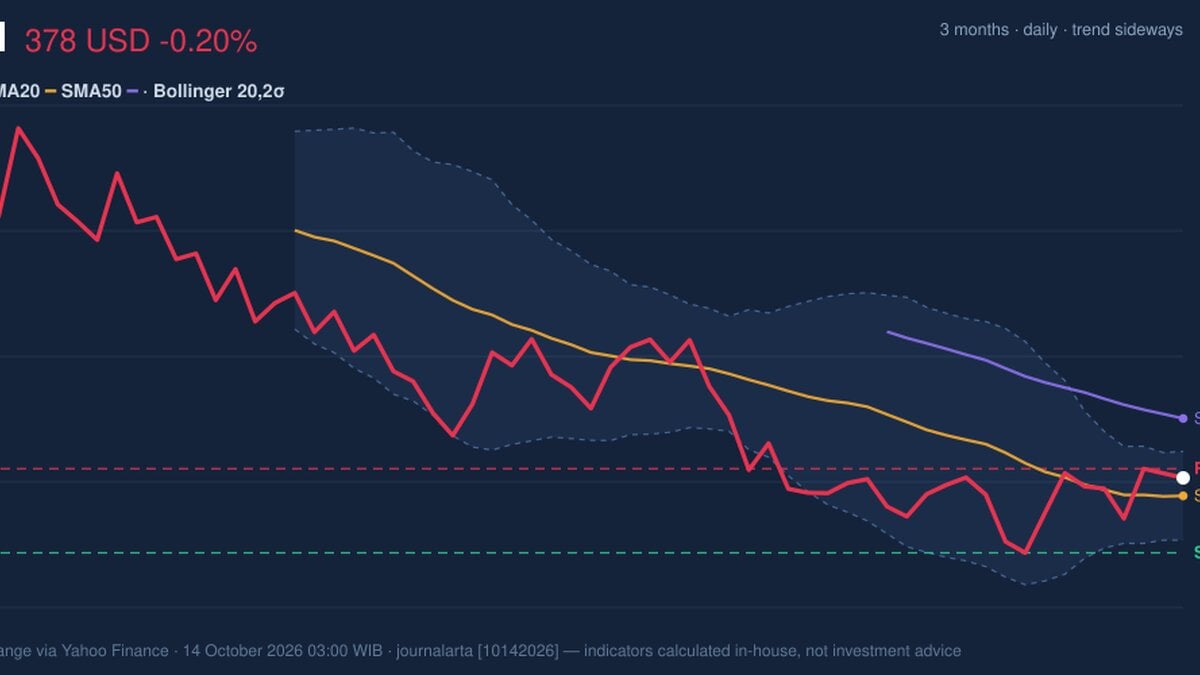
UNH was above its 20-day simple moving average (SMA) of $374.76, but below its 50-day SMA at $387.71. The shorter average’s slope was negative, and there was no recent crossover between the two averages. Together, those signals describe a stock stabilizing near its short-term trend line, not a confirmed change in direction. The share price sat near the top of its 20-day trading range: the stated support was $365.20 and resistance $379.30, placing UNH at 89% of that range. It also remained close to the upper Bollinger Band at $382.19, while the band’s width had narrowed to 4.0%. Narrowing bands indicate that recent price swings have contracted; they can precede a larger move, but do not indicate which way it will go. The immediate test is whether UNH can hold above its short-term average and clear resistance, rather than merely trade near the top of its recent range. The chart shows the price against the moving averages, Bollinger Bands and key levels.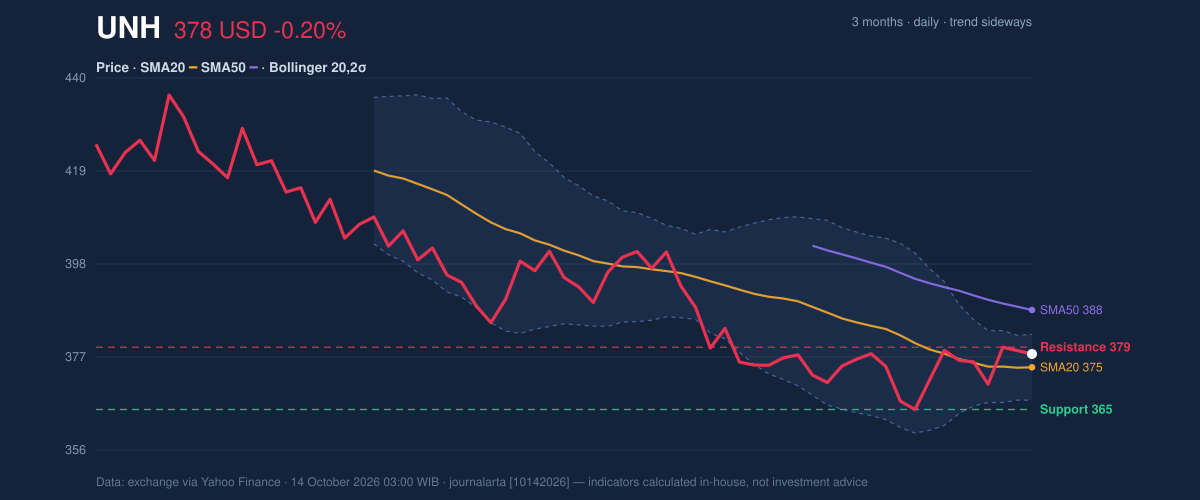
Oscillators & Momentum
The momentum readings are mixed rather than strongly directional. The Relative Strength Index (RSI), a measure of recent gains versus losses, was 47.8, a neutral reading. Stochastic %K at 40.7 and %D at 57.2 were also in neutral territory, with %K below %D—a sign that short-term momentum has not yet turned decisively higher. The Moving Average Convergence Divergence (MACD) offered a more constructive signal: its reading was -3.349, above its -4.970 signal line, with a positive histogram of 1.621. That points to improving momentum even though the MACD remains below zero, where the broader trend signal is still weaker. The positive histogram is therefore an early improvement, not confirmation that the downtrend has ended. MACD momentum is improving, while RSI and Stochastic remain neutral. The chart shows the RSI, MACD and Stochastic readings together.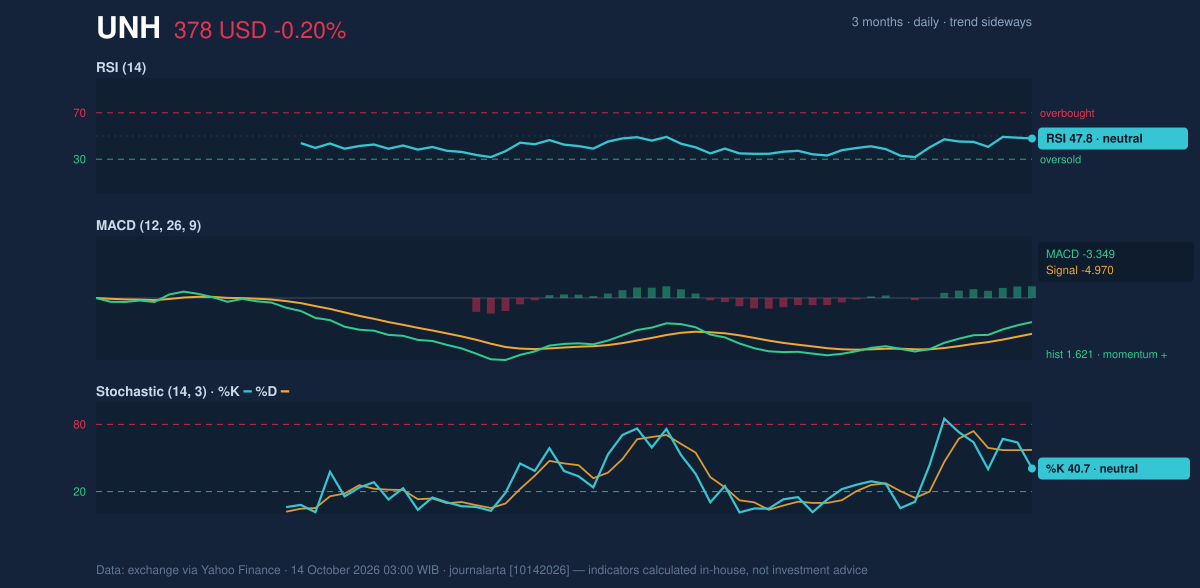
Volatility & Volume
The 14-day Average True Range (ATR), which estimates typical daily price movement, was $10.33, or 2.7% of the share price—moderate volatility by this measure. The narrow Bollinger Bands suggest that trading has been relatively contained, so a break beyond the nearby range could matter more than another small move within it. Volume reached 12,639,500 shares, compared with a 20-day average of 5,522,215. That surge makes the session more significant, but OBV was falling. OBV tracks whether volume tends to accompany rising or falling prices; its decline suggests the heavier activity has not yet translated into sustained accumulation. The gap between unusually high trading and falling OBV cautions against treating the volume spike alone as bullish confirmation.Key Levels & Scenarios
A sustained move above $379.30 would clear the stated 20-day resistance and could put the upper Bollinger Band at $382.19 into focus. A failure there would leave UNH trading near the upper edge of its recent range without confirming a breakout. On the downside, the 20-day SMA at $374.76 is the first short-term reference; a break below the stated $365.20 support would weaken the stabilization case. The three-month low was $362.60, close to that support, making the area a further marker of recent price weakness.Technical Verdict: HOLD (wait & see)
The technical verdict is HOLD (wait & see): UNH remains above its SMA20 and MACD momentum is improving, but it is still below the SMA50, its RSI and Stochastic readings are neutral, and falling OBV fails to confirm the volume surge. The verdict is invalidated if the price breaks below $365.20 support.- Ideal Entry Range: $374.76–$379.30, framed by the SMA20 and 20-day resistance.
- Exit Target: $382.19, the upper Bollinger Band and the next stated level above resistance.
- Stop Loss: $365.20, the stated 20-day support.
Data
Source: Market data from the exchange via Yahoo Finance, as of Oct. 14, 2026, 03:00 WIB. Last price: $377.76; previous close: $378.52. Change: -0.20% for one day, +0.38% for five days and +0.49% for one month. Trend: sideways; SMA20 slope: -0.50% over five days. SMA20: $374.76; SMA50: $387.71; no recent moving-average crossover. Bollinger Bands (20, 2σ): upper $382.19, middle $374.76, lower $367.32; %B 70%; width 4.0%, narrowing. RSI(14): 47.8; Stochastic %K: 40.7; %D: 57.2. MACD: -3.349; signal: -4.970; histogram: 1.621. ATR(14): $10.33, or 2.7% of price. Latest volume: 12,639,500; 20-day average: 5,522,215; OBV: falling. Support: $365.20; resistance: $379.30. Three-month high/low: $461.62/$362.60.
Why UNH is in focus today
- Volume at 2.3× the 20-day average
Selected automatically from 30 NYSE (US) stocks by a technical-signal score with daily weighted randomisation — not a recommendation.
Summary Data UNH
| Last price | 377.76 USD |
| Change 1 day / 5 days / 1 month | -0.20% / 0.38% / 0.49% |
| Trend / MA-cross | sideways / none |
| SMA20 / SMA50 | 374.76 / 387.71 |
| RSI (14) / Stochastic %K | 47.8 / 40.7 |
| Bollinger %B / ATR | 70% / 10.33 |
| Support / Resistance 20 days | 365.20 / 379.30 |
| Data as of | 14 October 2026 03:00 WIB |
Disclaimer: This technical analysis is generated automatically from exchange data (via Yahoo Finance) and indicators calculated by JournalArta, for information and education only. The verdict and the entry, target and stop-loss levels are not investment advice or a solicitation to buy or sell any security. Investment decisions and their risks rest solely with the reader.
Track UNH stock price daily: live levels, support/resistance and our full UNH analysis history.