On October 13, 2026: price 375.23 USD, trend uptrend, RSI 54.0, support 352.84, resistance 382.70. technical analysis of tsla stock. TSLA Momentum Gains — full…
By matthew jonathan
October 14, 20264 min read
TSLA Momentum Gains
Tesla fell 0.74% to $375.23 on Nasdaq, while its price remained above the rising 20-day average and its MACD stayed positive. The shares are worth watching after JournalArta had not covered the stock in the previous 14 days; the latest session’s trading volume was about half its 20-trading-day average, however, so the move came with limited participation.
Trend & Price Action
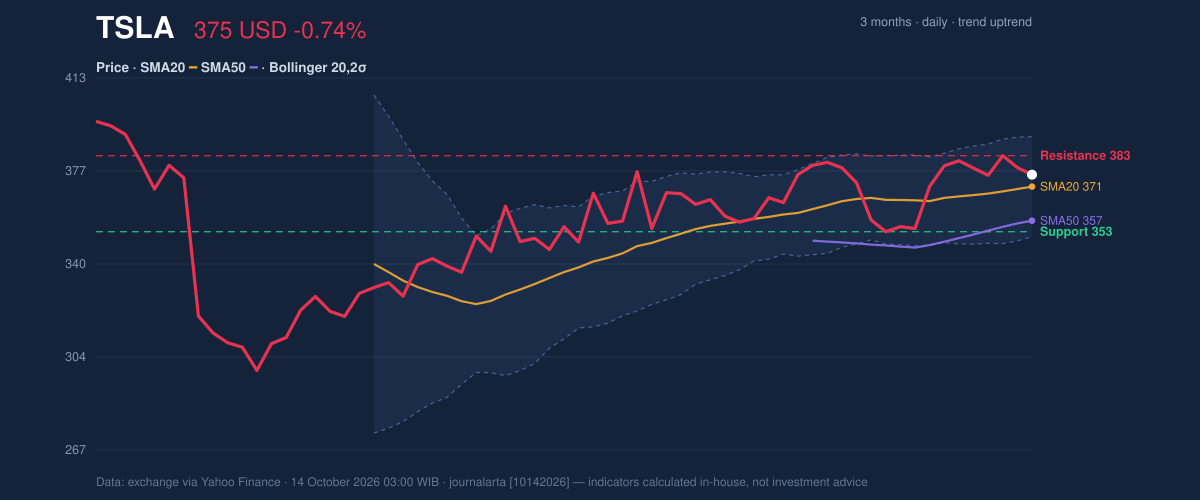
Tesla’s short-term structure remains upward: the 20-day simple moving average (SMA) is $370.54 and has risen 1.04% over five trading days, while the 50-day SMA stands at $357.14. The price is above both averages, a sign that recent trading strength has not yet been undone by the latest decline. There has been no new moving-average crossover, so the trend signal comes from the averages’ position and slope rather than a fresh technical trigger.
The stock sits about three-quarters of the way through its 20-trading-day range, between support at $352.84 and resistance at $382.70. That places it nearer the upper boundary, where a sustained advance would need to overcome resistance, rather than a level from which a breakout can be assumed. Tesla remains below its three-month high of $406.59 and above the period low of $297.38.
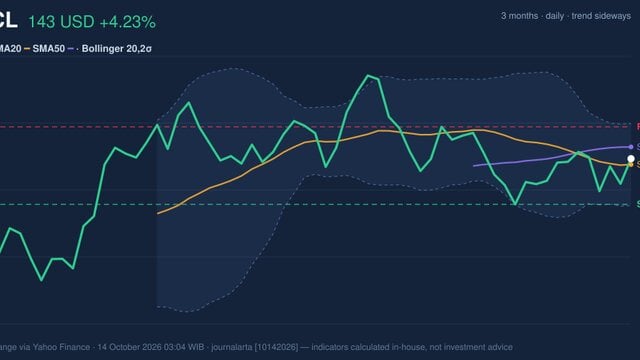
As shown in the chart, the Bollinger middle band aligns with the 20-day average at $370.54; the upper and lower bands are $390.17 and $350.92. Price is above the middle band, while a %B reading of 62% puts it in the upper half of the band without approaching the top. The band width of 10.6% is normal, not a squeeze that would signal unusually compressed trading conditions.
3-month price action chart of TSLA: price, SMA20/50, Bollinger, support & resistance. Data: exchange via Yahoo Finance.
Oscillators & Momentum
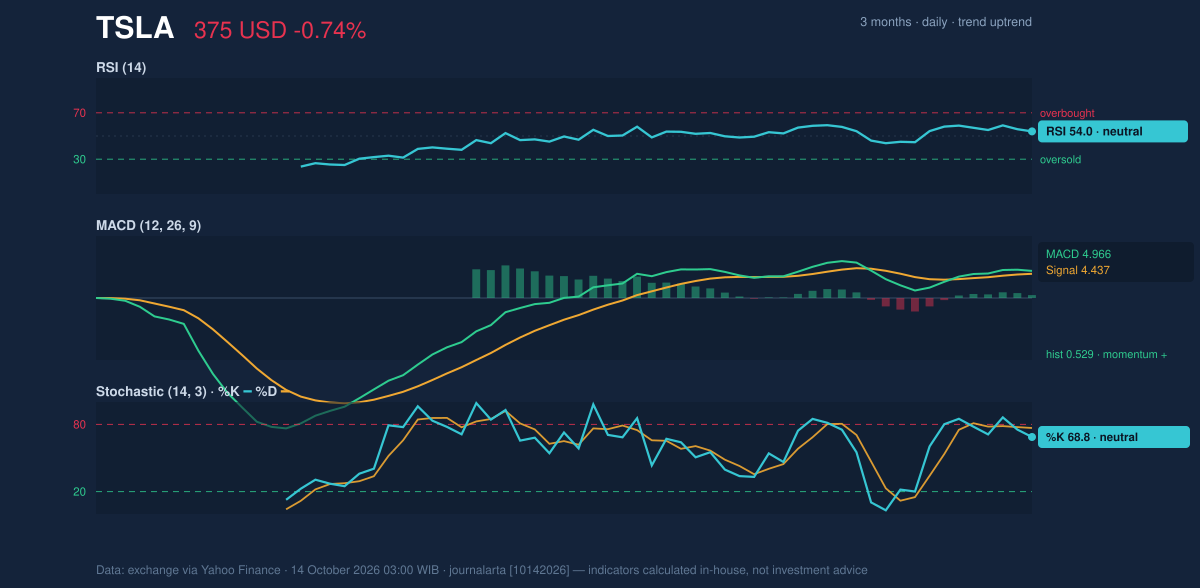
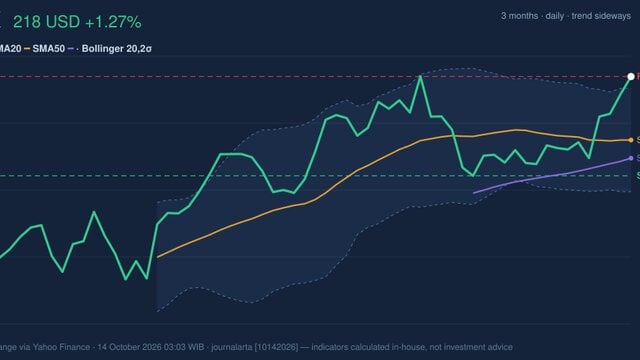
Momentum readings are constructive but not emphatic. The RSI is neutral at 54.0, indicating neither a strongly overbought nor oversold condition. The Stochastic is also classed as neutral, with %K at 68.8 and %D at 76.8; K below D suggests near-term momentum has cooled, even as both readings remain consistent with a stock that has recently traded in the upper part of its range.
The MACD remains positive: its 4.966 reading is above the 4.437 signal line, leaving a positive histogram of 0.529. In plain terms, the faster trend measure still points to upward momentum, but the modest gap between the lines is not, by itself, proof of accelerating gains. The mixed message—positive MACD, neutral RSI and a softer Stochastic—fits consolidation more than a decisive reversal.
Momentum chart of TSLA: RSI(14), MACD, Stochastic. Data: exchange via Yahoo Finance.
Volatility & Volume
Average true range (ATR), a measure of typical daily price movement, is $10.68, or 2.8% of the share price. That indicates moderate volatility: swings can be meaningful, but the data do not show an unusually wide trading environment. Tesla lost 1.43% over five days despite gaining 5.23% over one month, a short pullback within a stronger monthly performance.
The latest volume was 18,349,700 shares against a 20-day average of 34,631,850, or roughly 0.5 times normal and classified as thin. This weakens the confirmation behind the daily decline: fewer shares changed hands than usual. On-balance volume (OBV), which tracks whether volume is flowing more with rising or falling sessions, is rising. That offers a counterpoint to the subdued session, though it does not erase the need for price to hold support.
Key Levels & Scenarios
A hold above the $370.54 SMA20 would keep the short-term trend structure intact and leave the $382.70 resistance as the next level to test. A move through resistance would improve the price structure, though the data do not establish that such a break has occurred. Failure to hold the 20-day average would shift attention toward the $352.84 support; a break below that level would weaken the present uptrend reading. The lower Bollinger band at $350.92 provides a nearby additional reference, not a guarantee of a floor.
Technical Verdict: HOLD (wait & see)
The technical balance supports a wait-and-see reading rather than a directional signal. First, price remains above rising SMA20 and SMA50, preserving the uptrend. Second, MACD is positive and OBV is rising. Third, neutral RSI and Stochastic, thin volume, and resistance at $382.70 leave the strength of any renewed advance unconfirmed.
The verdict is invalidated if price falls below $352.84, the 20-trading-day support.
- Ideal Entry Range: $370.54–$352.84, bounded by the SMA20 and 20-day support.
- Exit Target: $382.70, the 20-day resistance.
- Stop Loss: $350.92, the lower Bollinger band; a move below it would signal additional deterioration.
For non-traders, the indicators show an intact but unconfirmed upward trend, with support and resistance likely to determine the next technical signal.
Data: Nasdaq market data via Yahoo Finance, as of 14 October 2026, 03:00 WIB.
Summary Data TSLA
Last price
375.23 USD
Change 1 day / 5 days / 1 month
-0.74% / -1.43% / 5.23%
Trend / MA-cross
uptrend / none
SMA20 / SMA50
370.54 / 357.14
RSI (14) / Stochastic %K
54.0 / 68.8
Bollinger %B / ATR
62% / 10.68
Support / Resistance 20 days
352.84 / 382.70
Data as of
14 October 2026 03:00 WIB
Disclaimer: This technical analysis is generated automatically from exchange data (via Yahoo Finance) and indicators calculated by JournalArta, for information and education only. The verdict and the entry, target and stop-loss levels are not investment advice or a solicitation to buy or sell any security. Investment decisions and their risks rest solely with the reader.