CSCO Stock Technicals: Gains 1.03% on Tuesday, Golden Cross Formed
On October 27, 2026: price 111.38 USD, trend sideways, RSI 52.7, support 104.89, resistance 118.39. technical analysis of csco stock. CSCO Stock Technicals —…
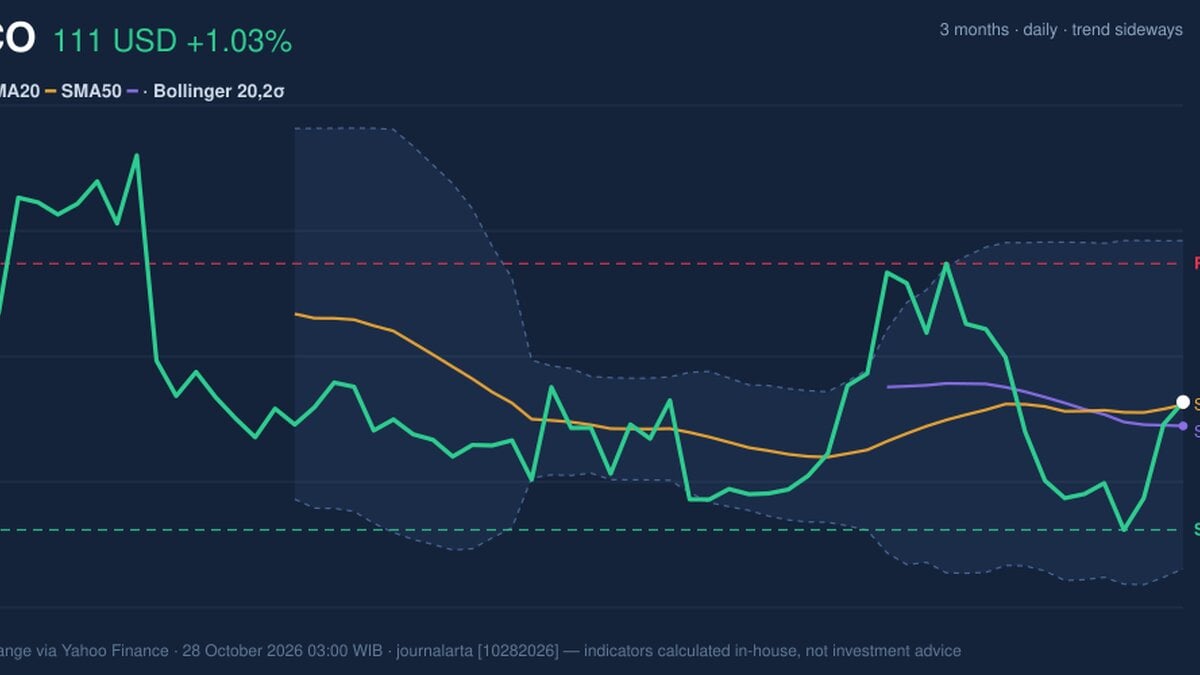
Cisco Systems rose 1.03% to $111.38 in Tuesday’s session, October 27, as the 20-day moving average crossed above the 50-day average four sessions earlier. The golden cross is a constructive signal: recent prices have begun to outperform the broader trend represented by the longer average. But subdued trading volume, falling on-balance volume and negative MACD momentum suggest the crossover has yet to draw strong confirmation from buyers.
Why CSCO is in focus today
- Fresh golden cross: SMA20 crossed above SMA50
Selected automatically from 32 NASDAQ (US) stocks by a technical-signal score with daily weighted randomisation — not a recommendation.
Trend & Price Action
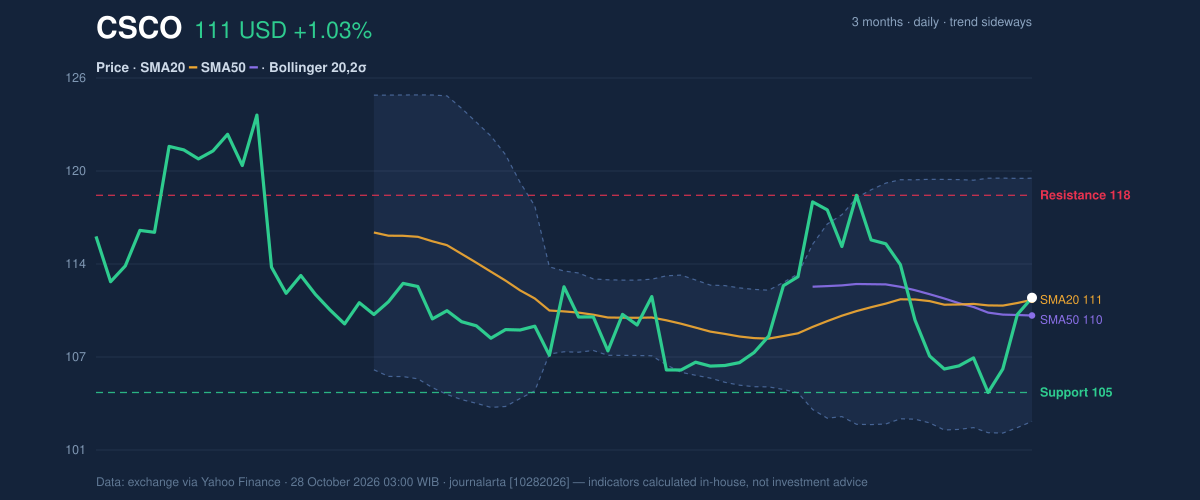
The stock gained 4.38% over five days and 4.15% over one month, while its broader trend remains sideways. Cisco closed just above its 20-day average of $111.24 and its 50-day average of $110.17. The 20-day average rose 0.29% over five days, a modest slope that points to gradual improvement rather than a decisive change in trend.
The crossover formed four sessions before the latest session, so it is still relatively recent, but it did not occur alongside a strong breakout: the closing price sits at 48% of its 20-day range, between support at $104.89 and resistance at $118.39. That position leaves room in either direction. A sustained move above resistance would strengthen the case that the sideways pattern is giving way; a retreat below support would undermine the bullish reading of the moving-average cross. As shown in the chart, the price remains near the middle of the Bollinger bands, not at an extreme.
Oscillators & Momentum
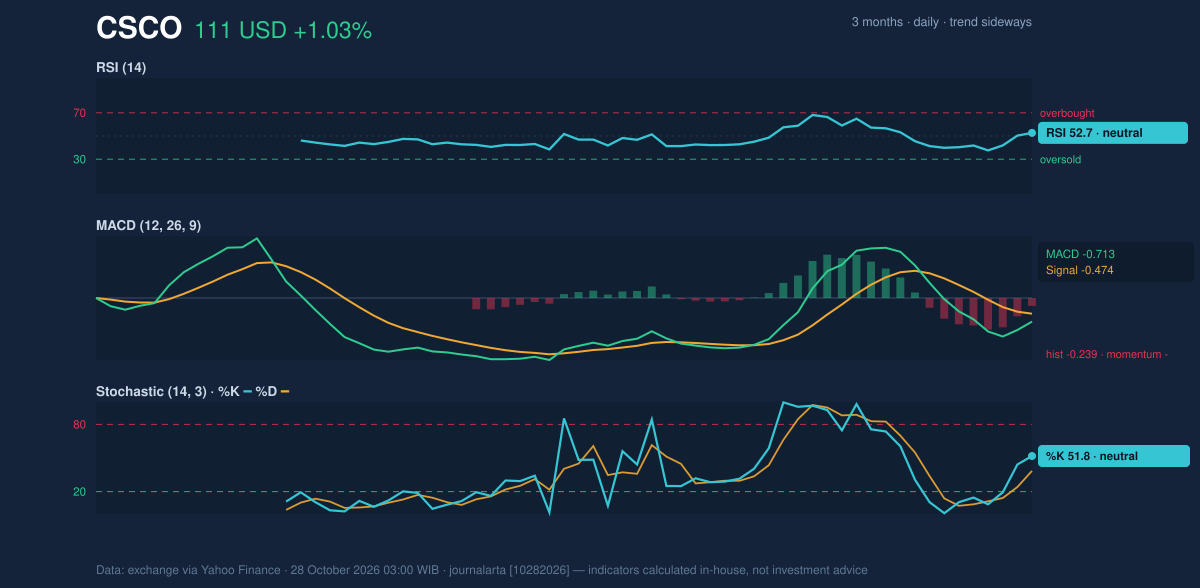
Momentum indicators offer a mixed rather than unified signal. The RSI, which gauges the pace of recent gains and losses, is neutral at 52.7; the Stochastic readings are also neutral, with %K at 51.8 and %D at 38.4. Neither measure indicates that the stock is stretched into overbought or oversold territory.
MACD, a trend-following measure that compares shorter- and longer-term price momentum, remains negative at -0.713, below its -0.474 signal line, with a histogram of -0.239. In plain terms, recent momentum still leans downward on this measure, despite the price gains and golden cross. That divergence matters: the crossover suggests improving trend structure, while MACD says the improvement has not yet become broad-based momentum. The chart makes the contrast between these readings easier to see.
Volatility & Trading Volume
The Bollinger bands are at normal width, with the upper band at $119.56, the middle line at $111.24 and the lower band at $102.92. Cisco’s %B reading of 51% places the stock almost exactly in the center of that range. This is consistent with consolidation, not a volatility squeeze that might signal an imminent sharp move or an established surge toward the upper band.
Average true range, a measure of typical daily price movement, is $3.14, or 2.8% of the share price, indicating moderate volatility. Volume of 14,153,400 shares was about 0.9 times the 20-session average of 15,601,790. OBV, which tracks whether volume is flowing more heavily on rising or falling days, declined. Together, lighter-than-normal participation and falling OBV temper the significance of the latest advance: price has risen, but trading activity does not yet show strong accumulation.
Key Levels & Scenarios
The nearest framework is the 20-session range, with support at $104.89 and resistance at $118.39. The three-month high of $124.71 is a broader reference above resistance, while the three-month low of $103.58 sits just below the 20-session support. A break above $118.39 would put the upper Bollinger band at $119.56 in focus; failure to hold $104.89 would shift attention toward the lower band at $102.92 and the three-month low.
Technical Verdict: HOLD (wait & see)
The technical picture is balanced: the golden cross and price above both moving averages are positive, but negative MACD, declining OBV and below-average volume leave confirmation incomplete. The verdict is invalidated if the price falls below $104.89, the 20-session support.
- Ideal entry range: $110.17–$111.24, around the 50-day and 20-day averages.
- Exit target: $118.39–$119.56, spanning 20-session resistance and the upper Bollinger band.
- Stop-loss protection: $104.89, at 20-session support.
For non-traders, the indicators point to a stock holding steady, with a possible trend improvement that still needs confirmation.
Market data: exchange data via Yahoo Finance, as of the October 27, 2026 trading session.
Summary Data CSCO
| Last price | 111.38 USD |
| Change 1 day / 5 days / 1 month | 1.03% / 4.38% / 4.15% |
| Trend / MA-cross | sideways / golden |
| SMA20 / SMA50 | 111.24 / 110.17 |
| RSI (14) / Stochastic %K | 52.7 / 51.8 |
| Bollinger %B / ATR | 51% / 3.14 |
| Support / Resistance 20 days | 104.89 / 118.39 |
| Data as of | 28 October 2026 03:00 WIB |
Disclaimer: This technical analysis is generated automatically from exchange data (via Yahoo Finance) and indicators calculated by JournalArta, for information and education only. The verdict and the entry, target and stop-loss levels are not investment advice or a solicitation to buy or sell any security. Investment decisions and their risks rest solely with the reader.
Track CSCO stock price daily: live levels, support/resistance and our full CSCO analysis history.