GOOGL Death Cross Pressure: Stock Gains 1.19% (October 27, 2026)
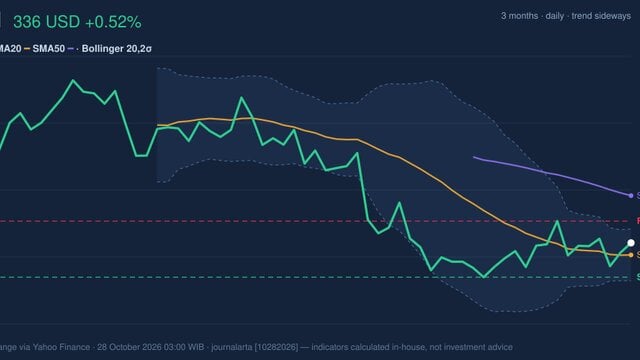
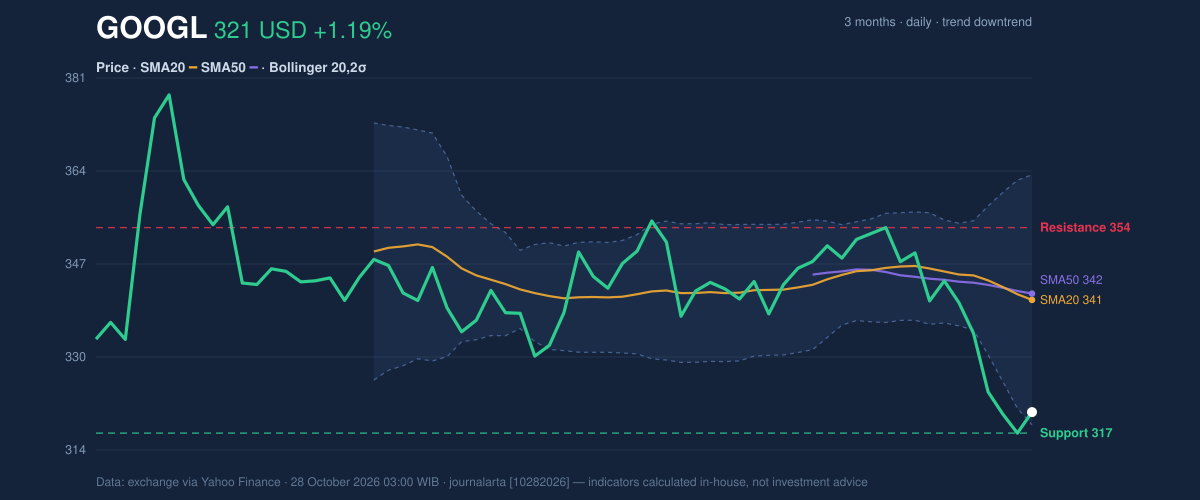
On October 27, 2026: price 320.58 USD, trend downtrend, RSI 34.4, support 316.80, resistance 353.78. technical analysis of googl stock.
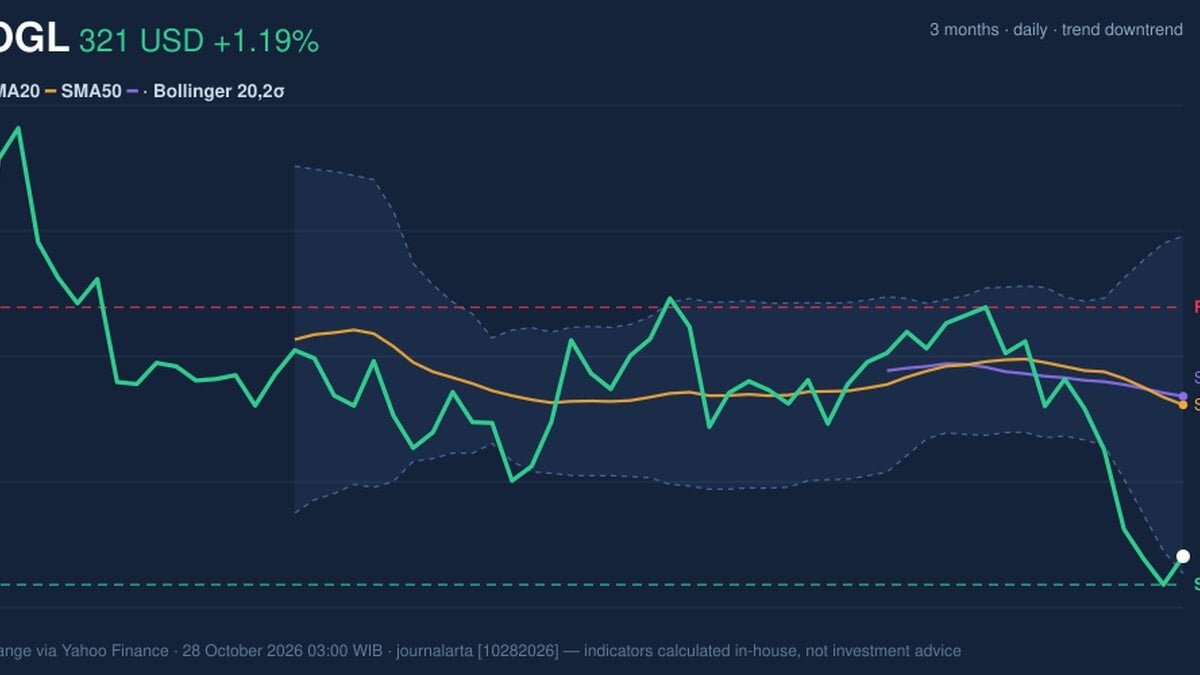
Trend & Price Action
Oscillators & Momentum
Momentum indicators remain weak, though they show that selling has pushed the stock toward an oversold reading. The RSI is 34.4, classified as neutral; the Relative Strength Index measures the pace of recent gains and losses, and this reading is below the level often associated with stronger momentum but not in the oversold category. The stochastic indicator is more stretched: %K is 9.3 and %D is 3.3, both in oversold territory. That can precede a bounce, but it is not confirmation that a reversal has begun. The MACD is negative at -5.814, below its -2.354 signal line, with a -3.461 histogram. MACD compares shorter- and longer-term price averages to gauge momentum. Its negative readings align with the falling averages, rather than confirming the one-day rise as a trend change. [ GRAFIK-MOMENTUM ]Volatility & Volume
Average True Range, a measure of typical daily movement, is $8.38, or 2.6% of the share price—moderate volatility. Trading volume was 28.5 million shares, about 1.2 times the 20-session average of 24.3 million. Higher-than-normal participation means the latest move drew more trading activity, but the falling On-Balance Volume (OBV), which tracks whether volume accompanies up or down sessions, offers no clear confirmation that buying pressure is building.Key Levels & Scenarios
The first test is $316.80 support, close to the three-month low of $316.60. If the price holds that area, an oversold stochastic reading leaves room for a short-lived rebound; resistance at $353.78 is a more substantial hurdle, still well above the current price and near the moving-average cluster. A sustained move through that zone would challenge the bearish structure. If support fails, the three-month low is the next relevant reference in the supplied data.Technical Verdict: HOLD (wait & see)
The indicators favor caution rather than a confident directional call: the death cross and falling 20-day average point to a downtrend; negative MACD confirms weak momentum; and the oversold stochastic reading raises the possibility of a rebound without proving one. This verdict is invalidated if the price falls below $316.80 support.- Ideal entry range: $316.80–$340.77, bounded by 20-day support and the 20-day average.
- Exit target: $353.78 resistance.
- Stop-loss protection: below $316.80 support.
Data: exchange market data via Yahoo Finance; technical levels and indicators as provided.
Why GOOGL is in focus today
- Trading near its 3-month low (316.60)
- Fresh death cross: SMA20 crossed below SMA50
- Downtrend extending (5-day change -5.79%)
Selected automatically from 32 NASDAQ (US) stocks by a technical-signal score with daily weighted randomisation — not a recommendation.
Summary Data GOOGL
| Last price | 320.58 USD |
| Change 1 day / 5 days / 1 month | 1.19% / -5.79% / -5.97% |
| Trend / MA-cross | downtrend / death |
| SMA20 / SMA50 | 340.77 / 341.89 |
| RSI (14) / Stochastic %K | 34.4 / 9.3 |
| Bollinger %B / ATR | 5% / 8.38 |
| Support / Resistance 20 days | 316.80 / 353.78 |
| Data as of | 28 October 2026 03:00 WIB |
Disclaimer: This technical analysis is generated automatically from exchange data (via Yahoo Finance) and indicators calculated by JournalArta, for information and education only. The verdict and the entry, target and stop-loss levels are not investment advice or a solicitation to buy or sell any security. Investment decisions and their risks rest solely with the reader.
Track GOOGL stock price daily: live levels, support/resistance and our full GOOGL analysis history.