META Testing Support Level: Stock Drops 1.64% (October 27, 2026)
On October 27, 2026: price 620.19 USD, trend sideways, RSI 32.0, support 620.19, resistance 762.50. technical analysis of meta stock. META Testing Support…
Why META is in focus today
- Volume at 2.5× the 20-day average
- Closed at a 20-day low (620.19)
Selected automatically from 32 NASDAQ (US) stocks by a technical-signal score with daily weighted randomisation — not a recommendation.
Trend & Price Action
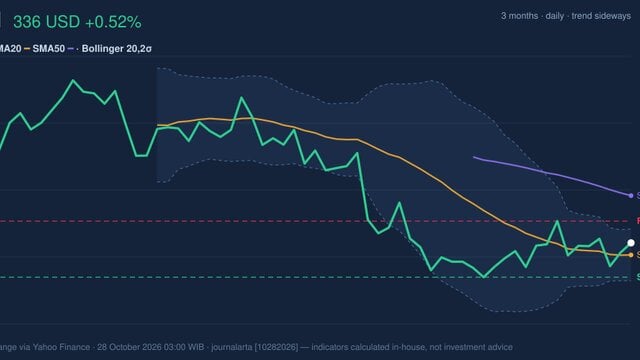
META’s shares have lost 10.67% over five sessions and 16.05% over one month, according to market data from the exchange via Yahoo Finance. The broader trend is classified as sideways, but the declining moving average points to deteriorating short-term structure: the 20-day average fell 3.33% over five days. The price is below both its 20-day average of $707.47 and its 50-day average of $665.65, a configuration that shows the recent weakness is not confined to a single trading day. There is no new moving-average crossover in the latest data. Still, the share price sitting well below both averages means they may act as resistance if the stock rebounds. The nearest support listed is $620.19, the current price and the bottom of the 20-day range; the 20-day resistance is $762.50. Over the past three months, META has ranged from $524.49 to $779.82, placing the latest close near the lower end of that wider band as well. The Bollinger reading reinforces the pressure: price is below the lower band at $628.41, with %B at -5%. Bollinger Bands compare price with a moving average and its volatility range; a reading below the lower band signals an unusually weak position relative to recent trading, but does not by itself establish that a rebound is imminent. The bands have widened to 22.4%, indicating elevated volatility rather than a quiet consolidation.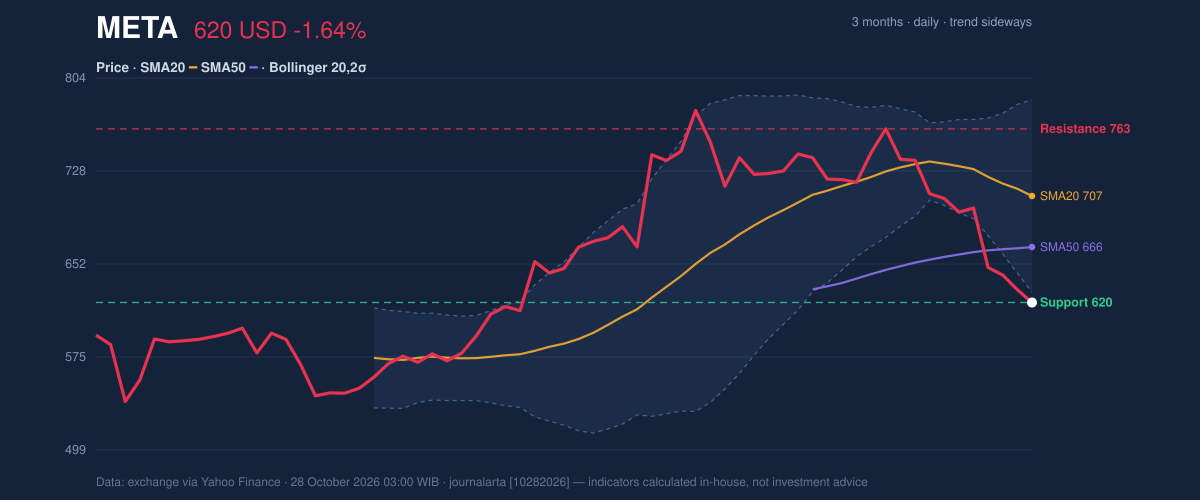
Oscillators & Momentum
The momentum indicators lean negative, though they differ on how stretched the decline has become. The RSI is 32.0, classified as neutral in the supplied data. RSI measures the speed and scale of recent price moves; this reading is close to, but not in, conventional oversold territory. By contrast, the Stochastic is oversold, with %K at 0.6 and %D at 3.1. That can signal that selling has been persistent, but oversold conditions can endure when a price trend is weak. The MACD is negative, at -11.736 against a signal line of 4.583, with a histogram of -16.319. MACD compares shorter- and longer-term price momentum; its negative configuration indicates downside momentum is still dominant rather than confirming a reversal. The gap between an oversold Stochastic and a negative MACD is a warning against treating one indicator as a standalone turning point.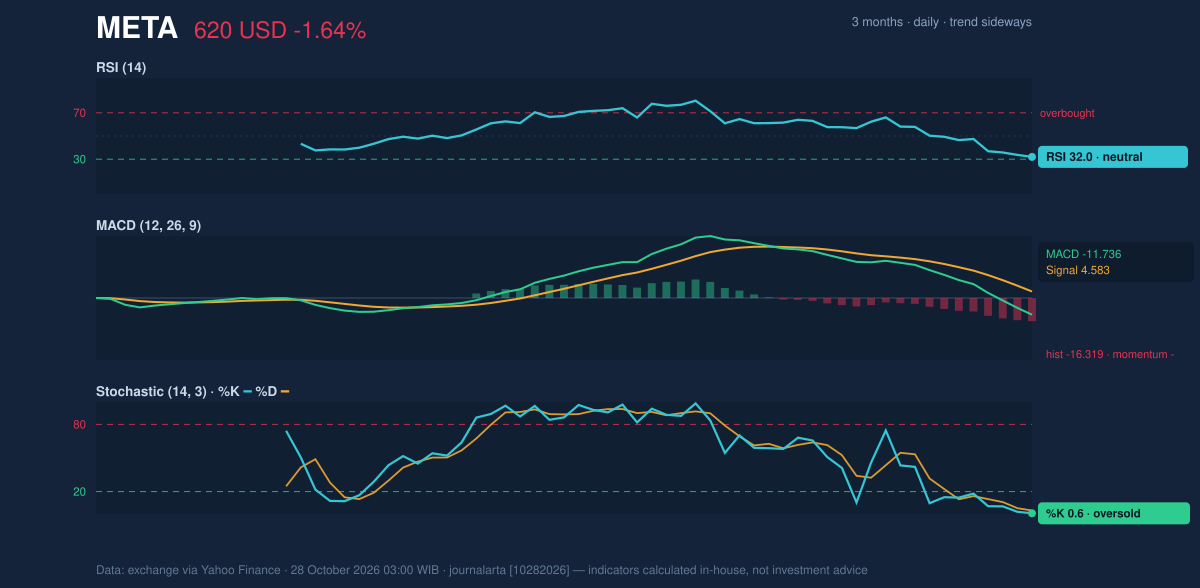
Volatility, Volume & Levels
Average true range, a measure of typical price movement, is $25.40, or 4.1% of the share price—high volatility by the supplied reading. Combined with the widening Bollinger Bands, that means the stock has been moving forcefully, so a test of support could be accompanied by substantial daily swings. Volume totaled 51,263,800 shares, compared with a 20-day average of 20,787,530. The 2.5-times surge, alongside a falling on-balance volume measure (OBV, which tracks whether volume is associated with buying or selling pressure), supports the view that selling participation has increased. It does not prove that selling is exhausted. The key near-term test is $620.19 support. A sustained hold there could provide a base for stabilization, but the indicators do not yet confirm one. A break below that level would put the broader three-month low of $524.49 in focus. On a recovery, $665.65—the 50-day average—would be an initial reference point, with $707.47 at the 20-day average and $762.50 as the listed 20-day resistance. The latest price remains at the bottom of its 20-day range, so those levels are potential hurdles, not evidence of a reversal.Technical Verdict: HOLD (wait & see)
HOLD (wait & see) is the clearest technical reading: the price is below both moving averages, MACD remains negative, and heavy volume with falling OBV confirms selling pressure. Oversold Stochastic readings and a close below the lower Bollinger Band raise the possibility of a sharp bounce, but they do not yet outweigh the weakening trend. The verdict is invalidated if the price breaks below $620.19 support.- Ideal entry range: $620.19–$665.65, conditional on support holding and the price recovering toward the 50-day average.
- Exit target: $707.47, the 20-day average, with $762.50 as the next listed resistance.
- Stop-loss protection: Below $620.19, the stated 20-day support.
Summary Data META
| Last price | 620.19 USD |
| Change 1 day / 5 days / 1 month | -1.64% / -10.67% / -16.05% |
| Trend / MA-cross | sideways / none |
| SMA20 / SMA50 | 707.47 / 665.65 |
| RSI (14) / Stochastic %K | 32.0 / 0.6 |
| Bollinger %B / ATR | -5% / 25.40 |
| Support / Resistance 20 days | 620.19 / 762.50 |
| Data as of | 28 October 2026 03:00 WIB |
Disclaimer: This technical analysis is generated automatically from exchange data (via Yahoo Finance) and indicators calculated by JournalArta, for information and education only. The verdict and the entry, target and stop-loss levels are not investment advice or a solicitation to buy or sell any security. Investment decisions and their risks rest solely with the reader.
Track META stock price daily: live levels, support/resistance and our full META analysis history.