MU Stock Gains 2.77% on Tuesday, Death Cross Pressure
On October 27, 2026: price 928.76 USD, trend downtrend, RSI 46.3, support 856.49, resistance 1,097.39. technical analysis of mu stock. MU Stock Gains — full…
Why MU is in focus today
- Fresh death cross: SMA20 crossed below SMA50
Selected automatically from 32 NASDAQ (US) stocks by a technical-signal score with daily weighted randomisation — not a recommendation.
Trend & Price Action
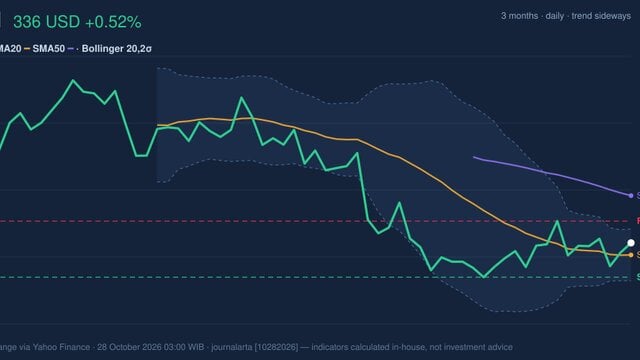
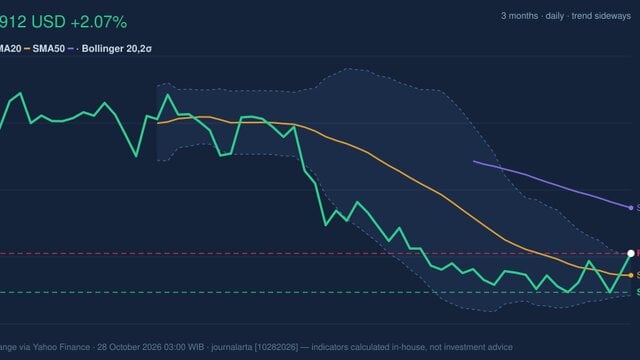
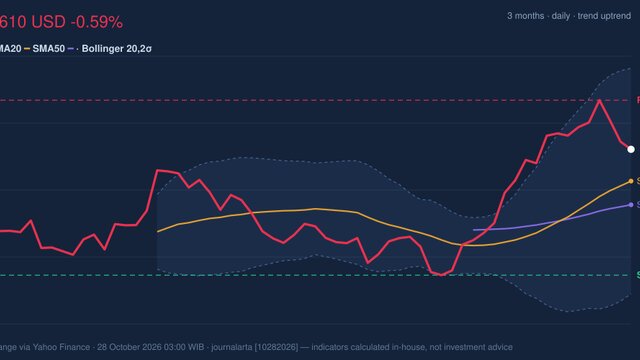
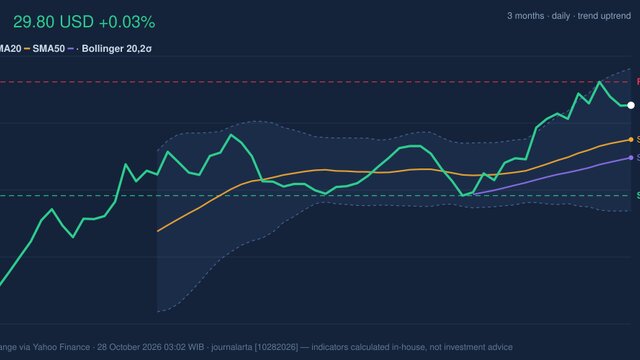
MU remains below its 20-day simple moving average (SMA20), at $972.37, and its 50-day average, at $979.71. The SMA20 is falling, with its slope down 4.30% over five days. The death cross formed one session before the latest session: the SMA20 moved below the SMA50, a signal that recent price momentum has weakened relative to the longer trend. It is not a guarantee of further declines, but it raises the bar for interpreting a rebound as a durable turn. The closing price sits about 30% of the way through its 20-session range, between support at $856.49 and resistance at $1,097.39. MU is also well below its three-month high of $1,108.72, though above its three-month low of $737.88. The chart shows how the recent price sits against the moving averages, Bollinger bands and key levels.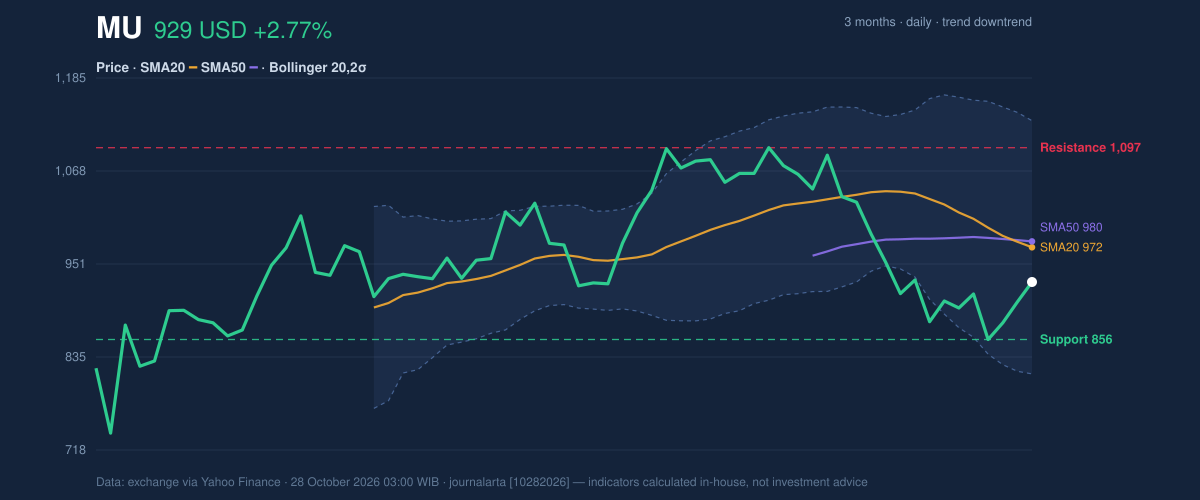
Oscillators & Momentum
The momentum indicators offer little confirmation of a decisive rebound. The RSI is neutral at 46.3, neither signaling an oversold reading nor showing strong upward pressure. The Stochastic is also neutral, with %K at 33.2 and %D at 22.6. These measures describe recent momentum, not the company’s underlying earnings or semiconductor demand. The MACD remains negative: its reading is -30.793, below the -22.323 signal line, while the histogram is -8.470. That configuration points to downward momentum still outweighing the recent daily gains. As shown in the chart, traders use the RSI, MACD and Stochastic together to judge whether a move is strengthening or losing force; here, they do not yet align behind a clear reversal.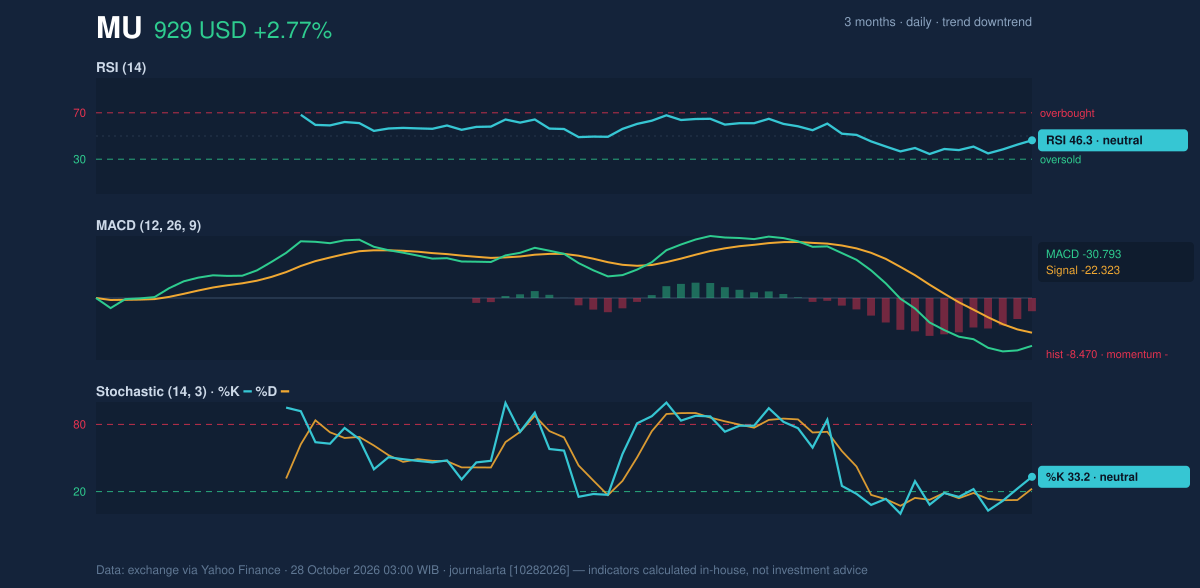
Volatility, Volume & Levels
Average true range (ATR), a measure of typical price movement, is $47.72, or 5.1% of the latest price. That is high volatility: even a modest change in market sentiment can produce a sizable daily swing. The latest volume of 22,855,300 shares was 0.8 times the 20-session average of 27,089,115, suggesting the rebound drew lighter-than-usual participation. On-balance volume (OBV), which adds or subtracts volume according to price direction, is rising. That divergence is a constructive signal, but it has not yet overcome the weak moving-average and MACD picture. The nearest reference levels are $856.49 support and $1,097.39 resistance. Holding support would keep the price within its established range; a break below it would invalidate a cautiously neutral reading. A move through resistance would be a more meaningful test of whether buyers can challenge the falling averages.Technical Verdict: HOLD (wait & see)
The technical verdict is HOLD (wait & see): the death cross and negative MACD argue for caution, while rising OBV and neutral oscillators leave room for stabilization. The price remains below both moving averages, and wide Bollinger bands plus a high ATR increase the risk of sharp moves in either direction. - Ideal entry range: $856.49–$972.37, bounded by 20-session support and the SMA20. - Exit target: $1,097.39, the 20-session resistance level. - Stop-loss protection: below $856.49; the verdict is invalidated if price falls below this support. For non-traders, the indicators point to a market that has bounced but has not yet demonstrated that its downward trend has ended. *Technical analysis is not an investment recommendation.*| Metric | Reading |
|---|---|
| Latest close | $928.76 |
| One-day / five-day / one-month change | +2.77% / +3.65% / -12.80% |
| SMA20 / SMA50 | $972.37 / $979.71 |
| Death cross | Formed one session before the latest session |
| RSI / Stochastic | 46.3 / %K 33.2, %D 22.6 |
| MACD / signal / histogram | -30.793 / -22.323 / -8.470 |
| Support / resistance | $856.49 / $1,097.39 |
Summary Data MU
| Last price | 928.76 USD |
| Change 1 day / 5 days / 1 month | 2.77% / 3.65% / -12.80% |
| Trend / MA-cross | downtrend / death |
| SMA20 / SMA50 | 972.37 / 979.71 |
| RSI (14) / Stochastic %K | 46.3 / 33.2 |
| Bollinger %B / ATR | 36% / 47.72 |
| Support / Resistance 20 days | 856.49 / 1,097.39 |
| Data as of | 28 October 2026 03:00 WIB |
Disclaimer: This technical analysis is generated automatically from exchange data (via Yahoo Finance) and indicators calculated by JournalArta, for information and education only. The verdict and the entry, target and stop-loss levels are not investment advice or a solicitation to buy or sell any security. Investment decisions and their risks rest solely with the reader.
Track MU stock price daily: live levels, support/resistance and our full MU analysis history.