Meituan Stock Technicals: Drops 2.81% on Thursday, Testing Support Level
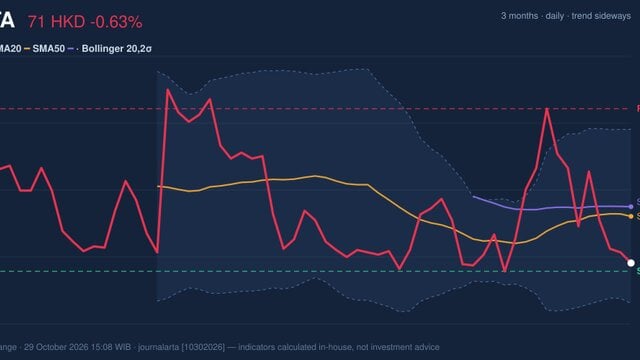
On October 29, 2026: price 69.20 HKD, trend sideways, RSI 38.3, support 69.20, resistance 77.10. technical analysis of meituan stock. Peak — full details here.
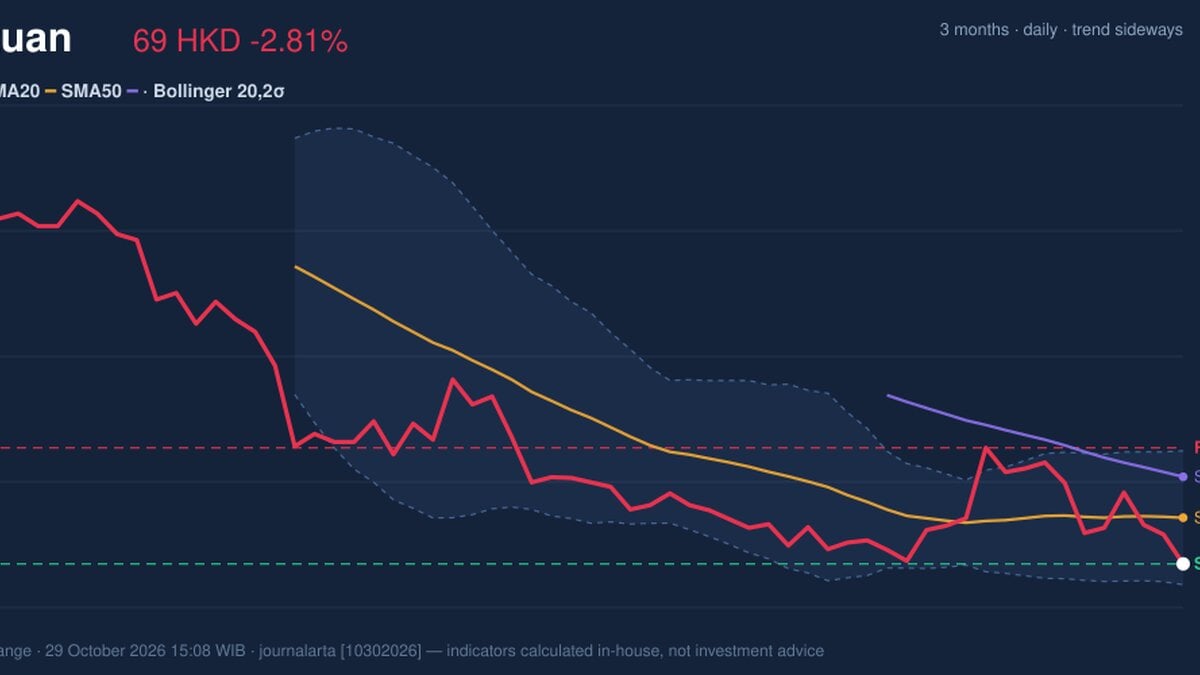
Why Meituan is in focus today
- Trading near its 3-month low (68.80)
- MACD histogram has just turned negative
- Not covered by JournalArta in the last 14 days
Selected automatically from 16 HKEX (Hong Kong) stocks by a technical-signal score with daily weighted randomisation — not a recommendation.
Trend & Price Action
Technically, the trend is classed as sideways. The 20-day moving average, which smooths the last 20 trading days of prices into one line, edged down just 0.08% over five days. A flat average suggests the stock has not been in a sharp, accelerating slide recently, but it also shows no sign of recovery. The price is below the 20-day average of 72.34, which in turn sits under the 50-day average of 75.13. This stacking, with price under the short average and the short average under the long one, is a classic bearish arrangement. It means recent buyers are, on average, holding losses. No new moving-average crossover has formed. As shown in the chart, the price has settled right on the 20-day support at 69.20, the very level where it closed. Resistance over the same window stands at 77.10. With the price at 0% of that range, the stock sits at the very bottom of its recent trading band.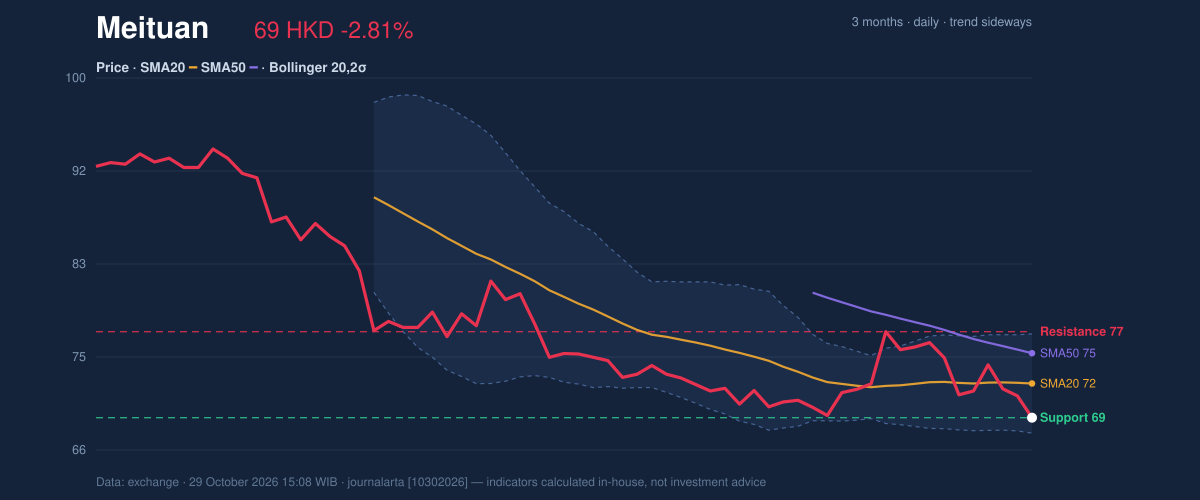
Oscillators & Momentum
Momentum gauges paint a mixed picture. The 14-day Relative Strength Index (RSI), which measures the speed of recent gains against losses on a 0-100 scale, reads 38.3. That is neutral, though leaning weak; readings below 30 are usually called oversold. The Stochastic oscillator is more extreme. Its %K line is at 1.7 and %D at 18.9, both deep in oversold territory. This indicator compares the closing price with the recent high-low range, so a reading near zero says the close was almost at the bottom of that range. It signals stretched selling, not necessarily a reversal. In weak trends, oscillators can stay depressed for extended periods. The MACD, a trend-following gauge based on the gap between short and long averages, stands at -1.012, below its signal line at -0.942. The histogram, the difference between the two, is -0.070. The histogram has only just turned negative, which means downward momentum has begun to reassert itself rather than being long established.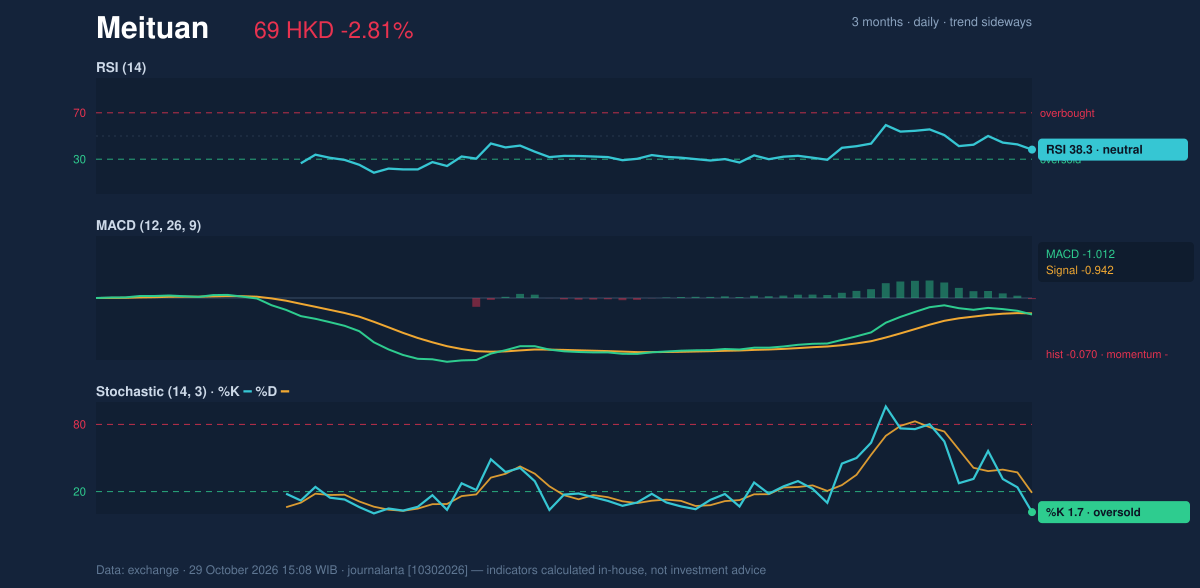
Volatility & Volume
Bollinger Bands, which draw a channel two standard deviations around the 20-day average, put the lower band at 67.78 and the upper at 76.90. The price sits at a %B of 16%, meaning it is in the lower sixth of the channel. Band width of 12.6% is normal, so there is no squeeze or sharp expansion in progress. Daily swings are nonetheless large. The 14-day Average True Range (ATR), a measure of typical daily price movement, is 2.94 HKD, or 4.2% of the price. That is high volatility, and it implies that a move of the distance between the close and the lower band, about 1.4 HKD, is well within an ordinary day's range. Trading volume was 27,477,018 shares, 1.1 times the 20-day average of 25,754,042. That is a slight increase, not a capitulation-style surge. On-balance volume, which adds volume on up days and subtracts it on down days, is falling, confirming that selling pressure has outweighed buying.Key Levels & Scenarios
Two floors sit close together: the 20-day support at 69.20 and the 3-month low at 68.80. The lower Bollinger band at 67.78 is the next reference below. If the price closes beneath 68.80, it would set a new 3-month low and would leave the lower band as the nearest marker. If it holds, the first hurdle is the 20-day average at 72.34, followed by the 50-day average at 75.13.Technical Verdict: HOLD (wait & see)
The verdict is HOLD (wait & see), for these reasons: - Price is below both the 20-day and 50-day averages, and OBV is falling, so the trend and volume lean negative. - Stochastic at 1.7 is deeply oversold, which argues against assuming further sharp losses without a bounce. - The MACD histogram has just turned negative, while RSI at 38.3 is neutral, so neither side holds a clear edge. Reference levels drawn from the data: - Entry range: 67.78 to 69.20, between the lower Bollinger band and the 20-day support. - Exit target: 72.34, the 20-day average, with 75.13 as a second reference. - Stop loss: below 67.78, the lower Bollinger band. The verdict is invalidated if the price breaks below 67.78, or conversely if it closes above 72.34 and reclaims the 20-day average. In plain terms, the stock is near its recent bottom but has not yet shown that sellers are exhausted, so the chart favors waiting for clearer confirmation. This is technical analysis, not an investment recommendation.Data Table
| Indicator | Value |
|---|---|
| Last price | 69.20 HKD |
| 1-day / 5-day / 1-month change | -2.81% / -2.95% / -1.77% |
| SMA20 / SMA50 | 72.34 / 75.13 |
| Bollinger lower / middle / upper | 67.78 / 72.34 / 76.90 |
| RSI(14) | 38.3 |
| Stochastic %K / %D | 1.7 / 18.9 |
| MACD / signal / histogram | -1.012 / -0.942 / -0.070 |
| ATR(14) | 2.94 (4.2%) |
| Support / resistance (20 days) | 69.20 / 77.10 |
| 3-month high / low | 96.45 / 68.80 |
Summary Data Meituan
| Last price | 69.20 HKD |
| Change 1 day / 5 days / 1 month | -2.81% / -2.95% / -1.77% |
| Trend / MA-cross | sideways / none |
| SMA20 / SMA50 | 72.34 / 75.13 |
| RSI (14) / Stochastic %K | 38.3 / 1.7 |
| Bollinger %B / ATR | 16% / 2.94 |
| Support / Resistance 20 days | 69.20 / 77.10 |
| Data as of | 29 October 2026 15:08 WIB |
Disclaimer: This technical analysis is generated automatically from exchange data and indicators calculated by JournalArta, for information and education only. The verdict and the entry, target and stop-loss levels are not investment advice or a solicitation to buy or sell any security. Investment decisions and their risks rest solely with the reader.
Track Meituan share price daily: live levels, support/resistance and our full Meituan analysis history.