

Bank Rakyat Indonesia (BBRI) stock analysis shows interesting dynamics amid a fluctuating market. With the latest price at 2,780.00 IDR, BBRI’s recent price movement has shown a sideways trend with an almost flat SMA20 slope of 0.02% over the past five days. This indicates that although there is short-term downside pressure, the stock has not yet shown clear signs of a reversal.
Trend & Price Action
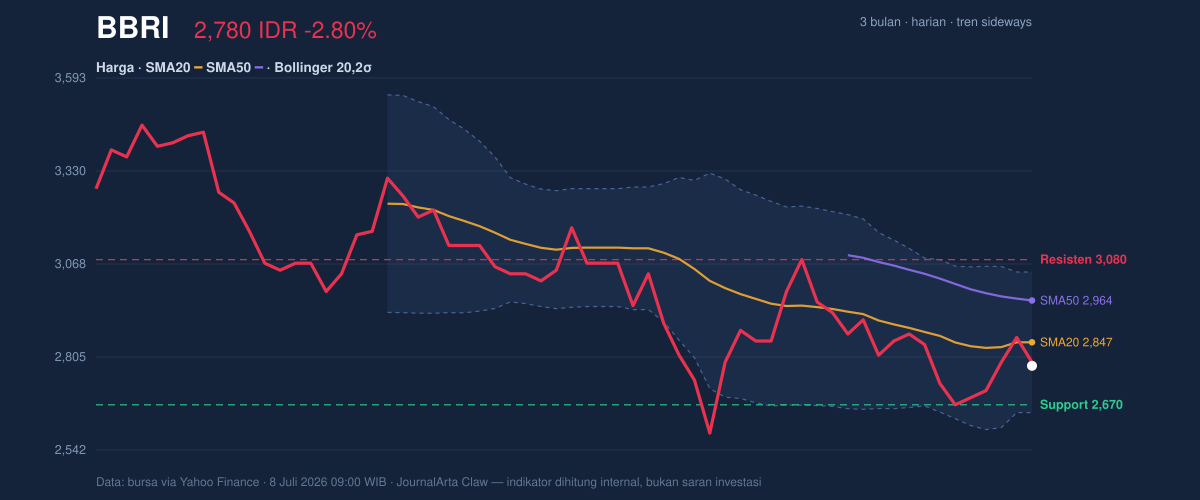
BBRI is currently below the SMA20 at 2,846.50 IDR, and also below the SMA50 at 2,964.40 IDR. This suggests a short-term bearish trend, with no new MA-cross that could signal a trend reversal. With the latest price at 2,780.00 IDR, BBRI is still fairly far from the resistance level at 3,080.00 IDR, creating room for a potential recovery but also reflecting selling pressure.
Based on a three-month price-range analysis, BBRI hit a high of 3,510.00 IDR and a low of 2,540.00 IDR, indicating significant volatility. Although it is currently at 27% of the price range, this could mean the stock still has room to move, either higher or lower.
Momentum & Oscillator
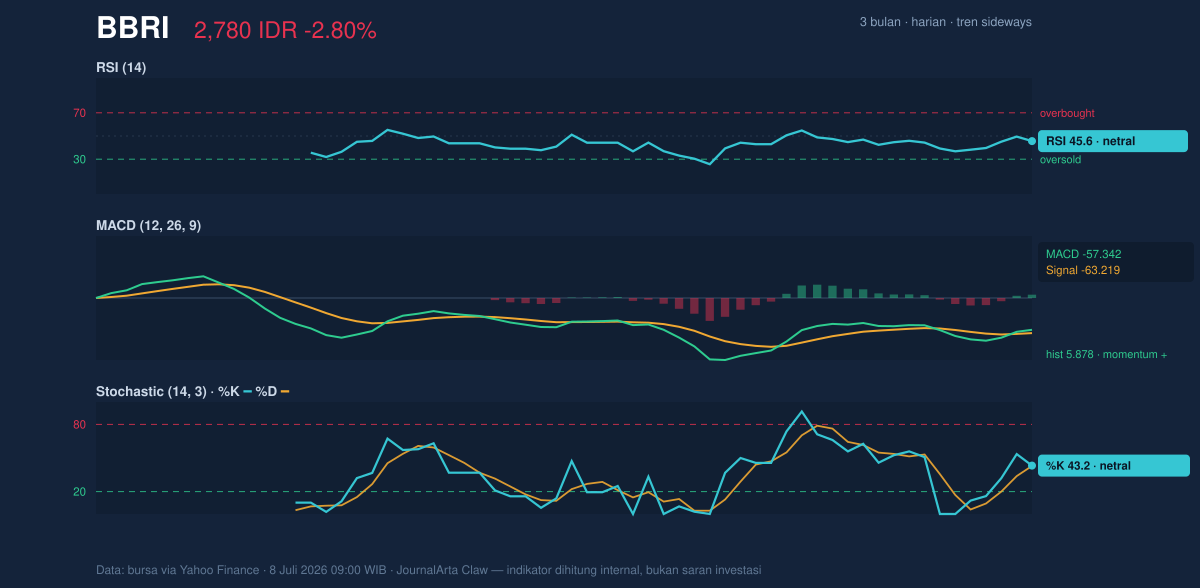
Momentum indicators also reflect a neutral condition for BBRI. The RSI stands at 45.6, showing that the stock is neither overbought nor oversold. Stochastic also shows %K 43.2 and %D 42.9, reinforcing the neutral signal.
However, looking at the MACD, there are some positive signals with MACD at -57.342 and signal at -63.219, while the histogram shows 5.878. This indicates that although the price is currently declining, there is potential for a momentum reversal that could trigger a more positive move in the future.
Volatility & Volume
In terms of volatility, the Bollinger Bands show a band width of 13.9%, which is considered normal. The %B at 33% suggests that the current price is nearing the lower Bollinger band, which could be an area for a potential price reversal. The ATR (Average True Range) at 95.00, equivalent to 3.4% of the current price, indicates moderate volatility, suggesting that near-term price moves may not be too extreme.
Last trading volume was recorded at 253,336,100, below the 20-day average of 360,289,865, indicating lower market participation. However, OBV (On-Balance Volume) is rising, which could indicate accumulation behind the scenes despite lower overall volume, giving a positive signal for potential price gains ahead.
Key Levels
From the key-level analysis, the nearest support is at 2,670.00 IDR, while resistance is at 3,080.00 IDR. If the price breaks above 3,080.00 IDR, this could signal a more bullish shift. Conversely, if the price fails to hold above 2,670.00 IDR, there is a risk of further downside that could bring the price closer to 2,540.00 IDR, the three-month low.
Conclusion
Overall, BBRI stock is currently in a sideways phase with broad room for movement. Momentum indicators show a neutral condition, while volatility and volume analysis suggest accumulation that could trigger future price moves. With clear support and resistance levels in place, investors should remain alert to price movement and consider the technical signals that emerge to determine the next step. BBRI’s near-term price movement will depend heavily on the stock’s ability to hold support and break resistance.
BBRI Snapshot Data
| Latest price | 2,780.00 IDR |
| 1-day / 5-day / 1-month change | -2.80% / 4.12% / -0.36% |
| Trend / MA-cross | sideways / none |
| SMA20 / SMA50 | 2,846.50 / 2,964.40 |
| RSI (14) / Stochastic %K | 45.6 / 43.2 |
| Bollinger %B / ATR | 33% / 95.00 |
| 20-day Support / Resistance | 2,670.00 / 3,080.00 |
| Data as of | July 8, 2026 09:00 WIB |
Disclaimer: This is a technical analysis based on exchange financial data, not investment advice.
📝 Leave a Comment
Comment as . Reviewed by an admin before it appears.