

Stock market today, Meta Platforms (META) on the Nasdaq is showing a mixed but active setup. The shares last traded at $626.51, up 3.88% on the day and 7.17% over the past month. That points to near-term strength, even as technical analysis still places the stock in a sideways trend. Here’s a closer look at the price trend, momentum, volatility, volume, and the key levels that may shape the next move.
Trend & Price Action
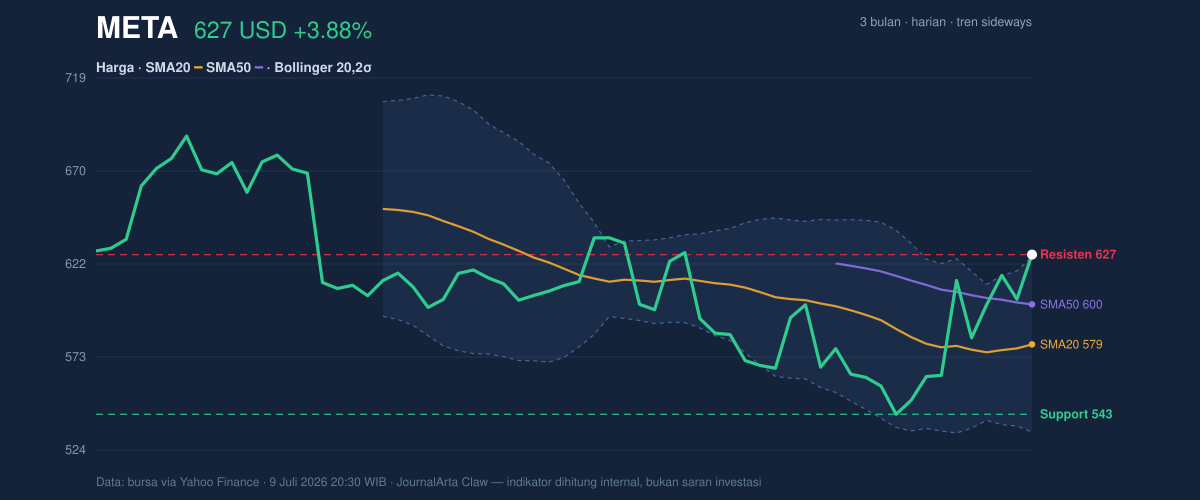
META is trading above its SMA20 at $579.45 and SMA50 at $600.39, a sign the stock remains in a relatively healthy position. Still, the SMA20 slope of just 0.13% over the past five days suggests price action lacks a clear directional surge. The stock is currently sitting at the 100% mark of its price range, with 20-hour support at $542.87 and 20-hour resistance at $626.51. A break above $626.51 could open the door to further gains, while a failure to hold above $542.87 raises the risk of another decline.
Momentum & Oscillators
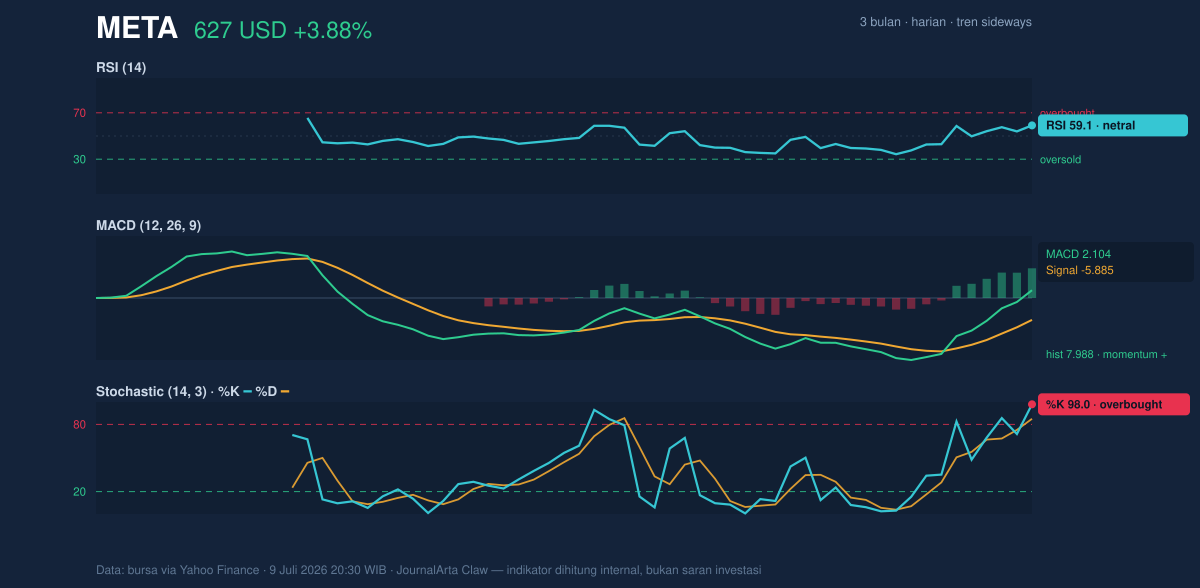
Momentum signals are mixed. The RSI stands at 59.1, which is neutral and does not show a strong overbought warning. But the Stochastic reads %K 98.0 and %D 85.0, suggesting the stock is overbought. That can be a warning sign of a possible reversal if selling pressure picks up. On the other hand, the MACD remains positive at 2.104, with the histogram at 7.988, reinforcing the current bullish tone. Even so, traders may want to stay alert for a pullback because of the overheated Stochastic reading.
Volatility & Volume
Volatility in META remains elevated, with ATR at 24.35, or about 3.9% of the share price. That suggests the stock could swing sharply in the near term. Bollinger Bands show the price trading above the upper band at $625.31, with %B at 101%, a sign the stock is stretched. The band width of 15.8% suggests volatility is still within a normal range. Recent volume came in at 17,699,054, slightly below the 20-day average of 18,676,643. The OBV trend is still rising, indicating that even with lighter trading volume, market participation remains constructive.
Key Levels & Scenarios
The main levels to watch are support at $542.87 and resistance at $626.51. If price breaks through $626.51, it could extend higher, helped by the positive MACD backdrop. If the stock slips below $542.87, selling pressure could intensify and put the 3-month low at $540.18 back in play.
Bottom Line
Meta Platforms (META) is showing a complex setup. The latest price at $626.51 points to upside potential, but the broader trend remains sideways and momentum indicators leave room for a reversal. High volatility and relatively soft volume add another layer of uncertainty. Traders are likely to keep a close eye on the key levels and momentum signals as the stock develops next.
META Snapshot
| Last price | $626.51 |
| 1-day / 5-day / 1-month change | 3.88% / 2.22% / 7.17% |
| Trend / MA cross | sideways / none |
| SMA20 / SMA50 | $579.45 / $600.39 |
| RSI (14) / Stochastic %K | 59.1 / 98.0 |
| Bollinger %B / ATR | 101% / 24.35 |
| 20-day support / resistance | $542.87 / $626.51 |
| Data as of | July 9, 2026 8:30 p.m. WIB |
Disclaimer: This is a technical analysis based on exchange data, not investment advice.
📝 Leave a Comment
Comment as . Reviewed by an admin before it appears.