

ExxonMobil (XOM) is drawing close attention in stock market today trading as the shares continue to weaken. At the latest close of $137.46, the stock was down 2.60% on the day and 7.69% over the past month, reflecting notable selling pressure. This technical review looks at the key signals that could shape the next move.
Trend & Price Action
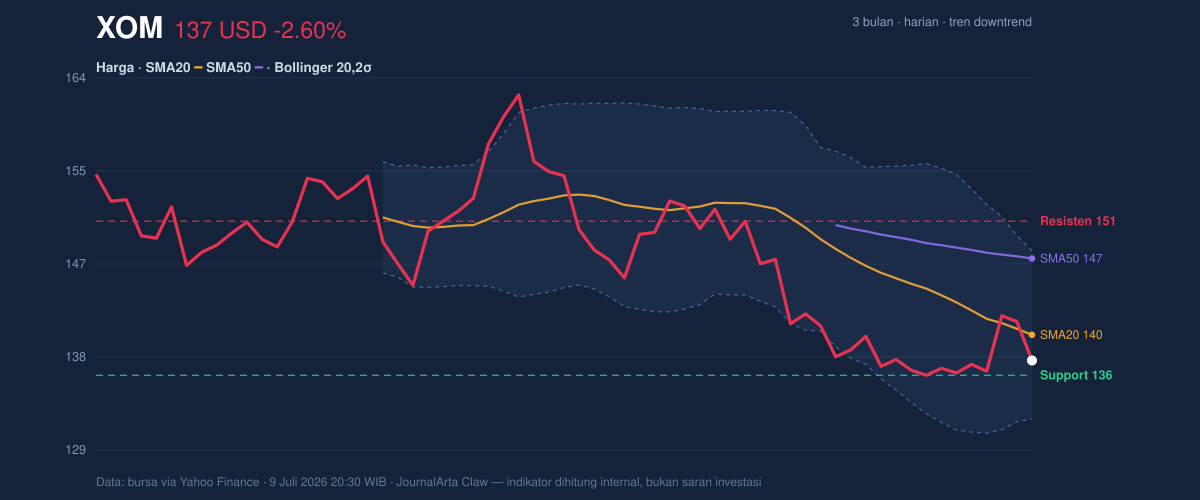
ExxonMobil is in a clear downtrend, with the stock trading below its SMA20 at $139.88 and its SMA50 at $147.09. That suggests sellers are still controlling the short-term picture. The SMA20 slope, down 2.15% over the last five days, adds to the case that bearish momentum remains intact.
On the chart, the stock is moving within a 3-month range between $134.95 and $163.68. With support at $136.06 and resistance at $150.62, the current price sits near the lower end of that band. A break below $136.06 could open the door to further downside. If the stock holds above that level, a rebound remains possible.
Momentum & Oscillators
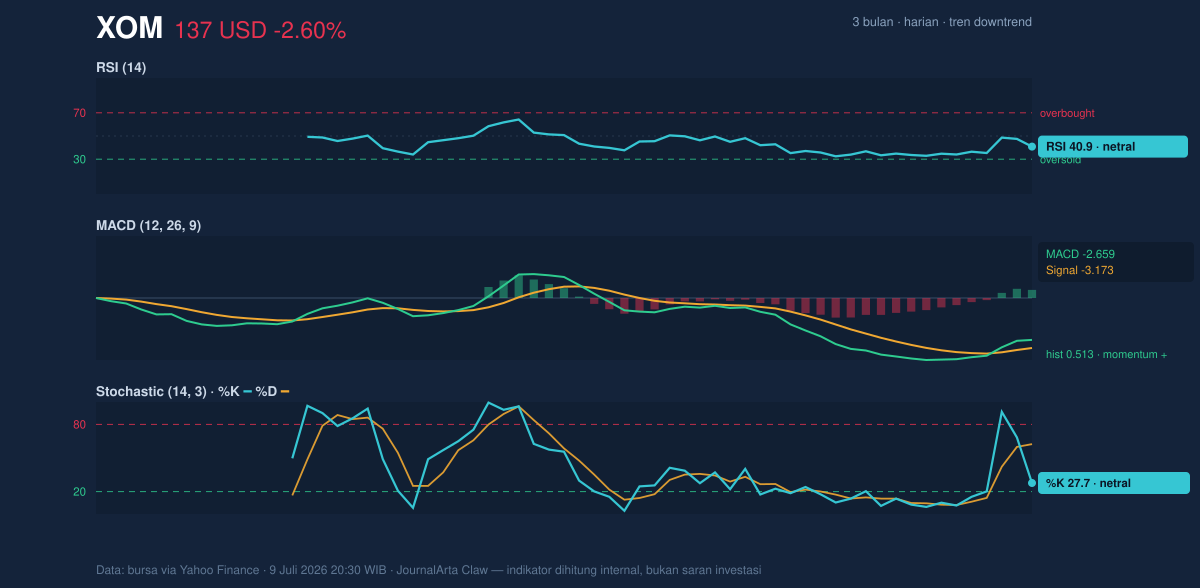
Momentum signals are mixed. The RSI stands at 40.9, which is neutral but edging toward oversold territory. The Stochastic reading also leaves room for a possible turn, with %K at 27.7 and %D at 62.4, though there is no strong reversal signal yet.
For MACD, the reading of -2.659 keeps the stock in bearish territory, while the histogram at 0.513 points to only a weak positive momentum shift. That combination suggests selling pressure is still present, even if price action could stabilize if broader market conditions improve.
Volatility & Volume
Volatility in ExxonMobil shares is currently moderate, with ATR at 2.93, or about 2.1% of the current price. That points to normal price swings rather than extreme turbulence.
Latest volume came in at 7,992,461, well below the 20-day average of 18,015,378. The weaker turnover, along with a declining OBV, suggests investor participation has been thin and buying interest has been limited.
Key Levels & Scenarios
The main levels to watch for ExxonMobil are support at $136.06 and resistance at $150.62. If the stock falls through $136.06, the bearish case could extend toward lower levels. If it can hold above that line and push through $150.62, a stronger rebound may follow.
Summary
Overall, ExxonMobil’s technical picture shows a stock in a downtrend with clear selling pressure. There are a few signs of improving momentum, and volatility is still contained, but trading remains below the SMA20 and SMA50, which keeps the near-term outlook cautious. Support at $136.06 is the critical level to watch, since a break could invite more downside. If it holds, the stock could attempt a recovery, but for now the market is focused on how price behaves next.
XOM Snapshot
| Latest price | $137.46 |
| 1-day / 5-day / 1-month change | -2.60% / 0.86% / -7.69% |
| Trend / MA cross | downtrend / none |
| SMA20 / SMA50 | $139.88 / $147.09 |
| RSI (14) / Stochastic %K | 40.9 / 27.7 |
| Bollinger %B / ATR | 35% / 2.93 |
| 20-day support / resistance | $136.06 / $150.62 |
| Data as of | July 9, 2026, 8:30 p.m. WIB |
Disclaimer: This is a technical analysis based on exchange data and is not investment advice.
📝 Leave a Comment
Comment as . Reviewed by an admin before it appears.