T Stock Gains 1.64%, Momentum Gains In Focus
On Agustus 4, 2026: price 23.59 USD, trend sideways, RSI 54.4, support 20.58, resistance 24.66. technical analysis of t stock. Stock Gains — full details here.

AT&T rose to 23.59 USD, up 1.64% on the day, but the more important signal is that the stock is still trading above both its short- and medium-term averages while momentum remains constructive. The move matters because it keeps the shares inside a recovery phase that has not yet turned into a clean breakout: the price is improving, but participation is still thinner than usual.
Trend & Price Action
As shown in the chart, AT&T is sitting in a sideways trend, yet the bias inside that range has improved. The stock is above its SMA20 at 22.34 and SMA50 at 22.84, which means recent prices are holding above both the one-month and roughly two-month average cost bases. In plain language, that often signals that buyers have regained enough control to keep pullbacks contained, even if the broader trend is not yet a full uptrend.
There is no fresh MA cross, so this is not a classic moving-average breakout story. Instead, the significance lies in the spread: price above both averages, with the SMA20 slope rising 3.04% over 5 days. That tells readers the short-term trend is improving faster than the medium-term one. The stock is also trading at about 74% of its 20-hour range, which places it in the upper part of the recent band without reaching the ceiling. That position usually suggests strength, but not yet exhaustion.
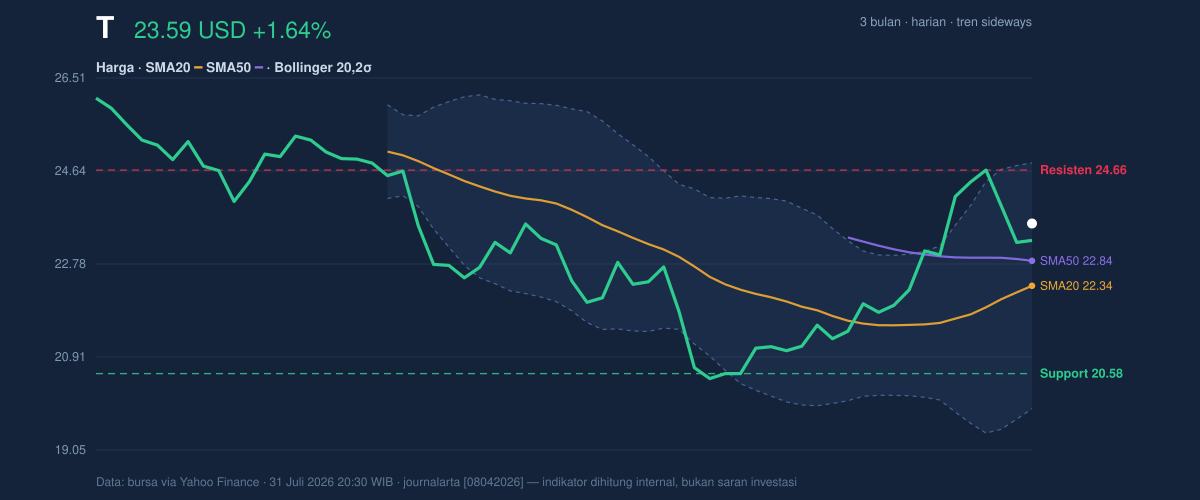
The 20-hour support at 20.58 and resistance at 24.66 frame the current debate. AT&T is closer to resistance than support, so the market is no longer pricing in weakness; it is testing whether demand is strong enough to absorb supply near the top of the range. The 3-month high of 26.14 remains a reference point for how far the stock has room to recover before it revisits its prior peak, while the 3-month low of 19.89 shows where sentiment would likely deteriorate if the recent improvement failed.
Oscillators & Momentum
The momentum picture is more balanced than the price chart. The RSI at 54.4 is neutral, which means the stock is neither overbought nor oversold. That matters because a neutral RSI after a daily gain suggests the advance is not yet stretched; the move still has room to continue if buyers keep showing up. The Stochastic %K at 49.1 and %D at 56.0 are also neutral, indicating the stock is not flashing a reversal warning from the short-term cycle.
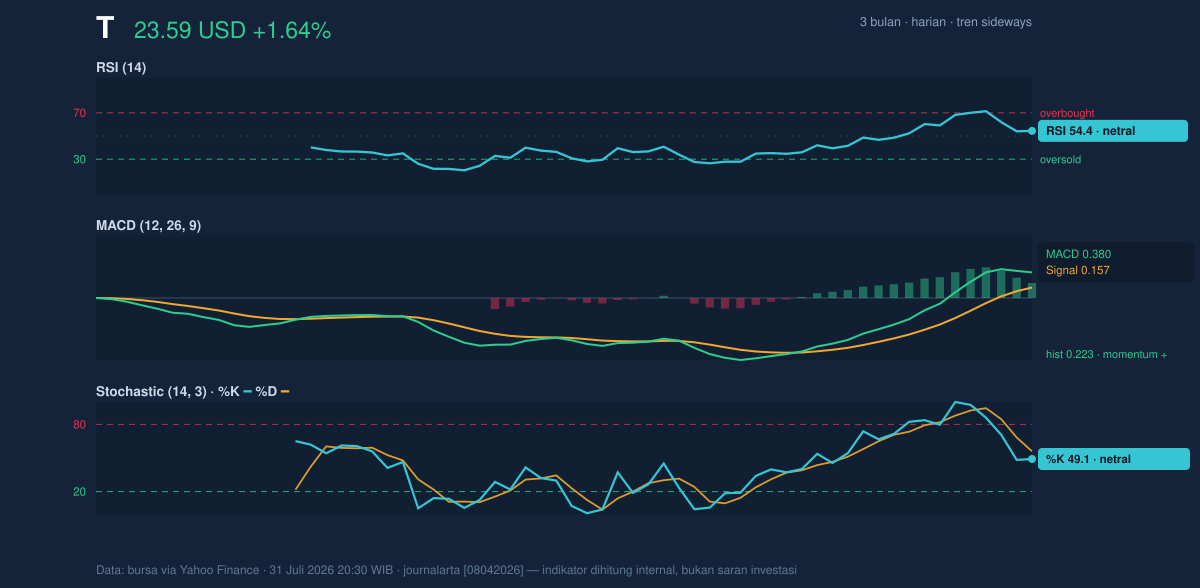
The cleaner signal comes from MACD. With MACD at 0.380, above the signal line at 0.157, and a positive histogram of 0.223, momentum is still tilted upward. For general readers, that means the recent price trend is moving faster than its own smoothing line, a sign that the latest advance is still being supported rather than fading. It is not a dramatic acceleration, but it is enough to confirm that the stock’s rebound has internal strength.
Volatility & Volume
Bollinger Bands add an important layer. The %B at 75% shows the price is trading in the upper portion of the band structure, closer to the upper band at 24.81 than the lower band at 19.88. That is a bullish location, but it also means the stock is approaching an area where gains can become harder to extend without fresh catalysts. The 22.1% band width is described as widening, which signals higher volatility. In practical terms, a wider band often means the market is preparing for a larger swing, not necessarily in one direction, but the current placement near the upper half of the band gives the bulls the near-term edge.
The ATR at 0.78, or 3.3% of price, suggests movement is moderate rather than wild. That is useful context: the stock can still move meaningfully, but the day-to-day range is not unusually chaotic. Volume complicates the picture. Last trade volume of 58,149,000 was only 0.7× normal versus the 20-hour average of 80,964,490. That means the rise happened without full market participation. In technical terms, a price move on lighter volume is less convincing than one backed by broad turnover. Still, OBV is rising, which implies that even if the latest session was quieter, the broader balance of buying pressure has been improving.
Key Levels & Scenarios
The main support to watch is 20.58. If the stock loses that zone, the chart would shift from constructive sideways action toward a more defensive posture, because that level sits well above the 3-month low of 19.89 and would likely be the first test of whether the recent rebound has real staying power. On the upside, 24.66 is the immediate resistance. A clean move through that level would matter because it would place the price above the recent ceiling and closer to the 24.81 upper Bollinger band, a combination that often attracts momentum traders and forces short-term sellers to reconsider.
The current setup is therefore less about a dramatic trend change and more about whether AT&T can keep consolidating above its averages long enough to challenge resistance. The chart shows a stock that is improving, but still needs confirmation from volume and a stronger push through the upper end of the range.
Technical Verdict: HOLD (wait & see)
HOLD (wait & see)
- Price is above SMA20 and SMA50, which is constructive, but there is no new MA cross to confirm a stronger trend shift.
- MACD is positive and the histogram remains above zero, but RSI 54.4 and Stochastic 49.1/56.0 are still neutral, so momentum is supportive rather than decisive.
- Volume is only 0.7× normal, which weakens the day’s advance even as OBV rises.
- Verdict invalidated if price falls below 20.58.
- Ideal Entry Range: 22.84 to 23.59
- Exit Target: 24.66
- Stop Loss protection: 20.58
In plain English, the chart says AT&T is improving, but the market has not yet proven that the move has enough force to break the next ceiling.
Summary Data T
| Last price | 23.59 USD |
| Change 1 day / 5 days / 1 month | 1.64% / -2.24% / 14.63% |
| Trend / MA-cross | sideways / none |
| SMA20 / SMA50 | 22.34 / 22.84 |
| RSI (14) / Stochastic %K | 54.4 / 49.1 |
| Bollinger %B / ATR | 75% / 0.78 |
| Support / Resistance 20 days | 20.58 / 24.66 |
| Data as of | 31 Juli 2026 20:30 WIB |
Track T stock price daily: live levels, support/resistance and our full T analysis history.


