Momentum Weakens, MA Stock Gains 0.11% Today
On September 29, 2026: price 568.26 USD, trend sideways, RSI 49.3, support 555.89, resistance 589.31. technical analysis of ma stock. Momentum Weakens — full…

Mastercard shares edged up to 568.26 dollars on the NYSE, a modest 0.11% gain from the previous close, but the tape still shows a name stuck in a narrow holding pattern rather than a clean directional move. The stock is trading below its 20-day average of 571.41 and slightly under the 50-day average of 569.32, while the broader trend remains sideways. That combination matters: when price sits under short-term moving averages, it usually signals that recent buying has not yet been strong enough to reclaim control, even if the decline has not turned into a full breakdown.
Trend & Price Action
The chart shows Mastercard positioned in the upper half of its recent range but not leading it. At 568.26, the stock is sitting at roughly 37% of the way up the 555.89 to 589.31 support-resistance band, which suggests it is closer to support than to an upside breakout zone. The 20-day SMA is sloping down by 1.44% over five days, a sign that short-term momentum has softened. Yet there is no fresh bearish crossover in the moving averages, and that absence is important: it means the chart has weakened, but not decisively cracked into a stronger downtrend.
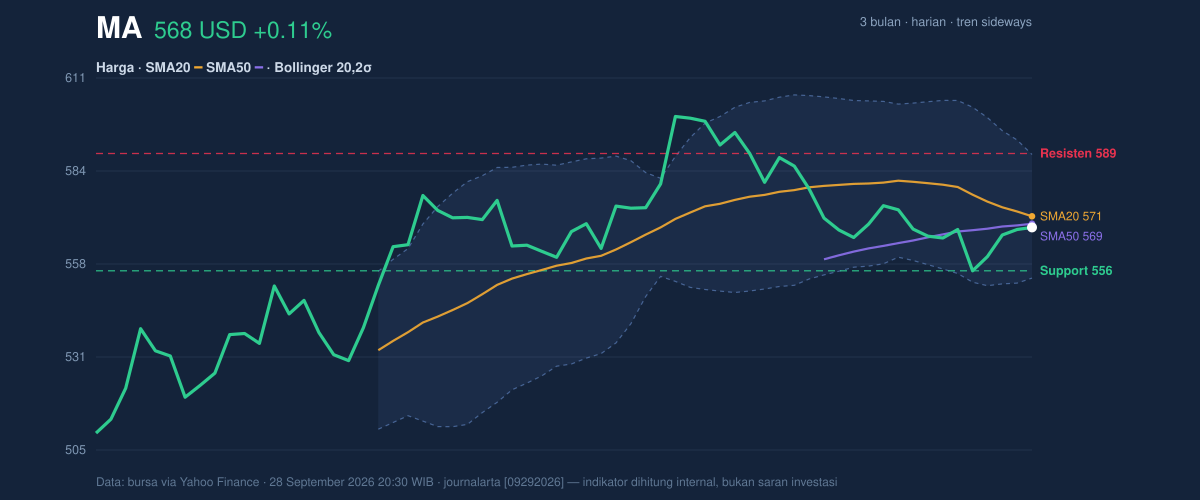
The 20-day Bollinger middle band at 571.41 now acts as a nearby reference point, and price below that line tells traders that the stock is still trading under its recent mean. The upper band at 589.03 and lower band at 553.79 frame the current battle. With the band width at just 6.2%, volatility is compressed. In plain terms, the stock is coiling. Narrow bands often precede a larger move, but they do not say which direction that move will take.
A short move, but not a quiet one.
Oscillators & Momentum
The momentum picture is mixed, and that is what makes the current setup more of a waiting game than a conviction trade. The RSI at 49.3 sits almost exactly in neutral territory, which means Mastercard is neither overbought nor oversold. The Stochastic %K at 58.7 and %D at 52.1 are also neutral, with no strong sign of an immediate reversal. In practical terms, these oscillators are not confirming a strong trend in either direction; they are telling readers the stock is balanced, with neither buyers nor sellers fully dominating.
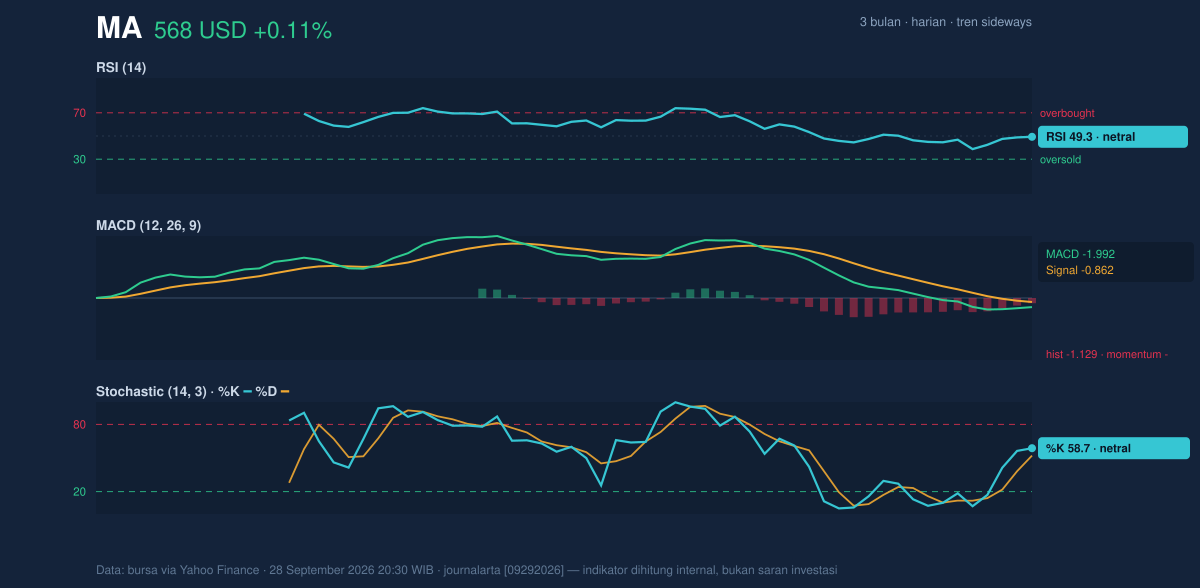
The more cautionary signal comes from MACD. The MACD at -1.992 remains below the signal line at -0.862, and the histogram at -1.129 is negative. For non-specialists, MACD is a trend-momentum gauge: when it stays below the signal line, it suggests downside pressure is still present even if price has stopped falling quickly. That matters here because the neutral RSI and Stochastic are not yet strong enough to offset the negative MACD reading. Put differently, momentum has not turned up in a convincing way.
Volatility & Volume
Activity is not absent, but it is not explosive either. Volume at 3,188,600 is about 1.2 times the 20-day average of 2,637,450, which means participation was a touch better than normal. That can be constructive if it accompanies a breakout or a rebound from support. But the OBV is falling, and that is a warning sign. OBV, or on-balance volume, tracks whether volume tends to arrive on up days or down days. A declining OBV suggests that, despite the recent uptick in activity, the broader flow of money has not been accumulating in a way that would usually support a sustained advance.
The ATR at 8.40, equal to about 1.5% of price, says daily swings are currently subdued. Low ATR often pairs with a squeeze in Bollinger Bands, and that is exactly what appears here. The signal is not “calm forever”; it is “calm before a decision.” A stock with compressed volatility can move sharply once it leaves the range, especially when momentum indicators are already leaning negative.
Key Levels & Scenarios
The market is watching the same two boundaries the chart is drawing: 555.89 on the downside and 589.31 on the upside. A hold above 555.89 would keep the current range intact and preserve the idea that this is a consolidation rather than a breakdown. A push through 589.31 would be more meaningful because it would clear resistance, reclaim the upper part of the recent band, and likely force a reassessment of the weak short-term trend. On the other hand, a failure to hold 555.89 would expose the lower Bollinger band at 553.79 and signal that the squeeze is resolving lower rather than higher.
The 3-month range adds context: Mastercard has traded between 502.50 and 601.23. That wider frame shows the current move is not happening at an extreme; it is occurring in the middle of a larger range, where false breaks are common and confirmation matters more than enthusiasm.
Technical Verdict: HOLD (wait & see)
HOLD (wait & see) is the clearest reading from the chart because the stock is compressed, but not yet aligned. The price below the 20-day SMA and the negative MACD argue for caution, while the neutral RSI, neutral Stochastic, and tight Bollinger Bands suggest the next move is not yet confirmed.
- Ideal Entry Range: 555.89 to 571.41, where support and the 20-day average overlap
- Exit Target: 589.31, with the upper Bollinger band at 589.03 as the nearby technical ceiling
- Stop Loss protection: below 553.79, the lower Bollinger band, or a clear break under 555.89
- Verdict invalidated if price breaks below 553.79
In plain English: Mastercard is not showing enough technical strength to claim control, but it is also not weak enough to dismiss, so the chart is waiting for the next decisive move. “The market is telling us to be patient — the setup is there, but the direction is not.”
Summary Data MA
| Last price | 568.26 USD |
| Change 1 day / 5 days / 1 month | 0.11% / 0.11% / -4.54% |
| Trend / MA-cross | sideways / none |
| SMA20 / SMA50 | 571.41 / 569.32 |
| RSI (14) / Stochastic %K | 49.3 / 58.7 |
| Bollinger %B / ATR | 41% / 8.40 |
| Support / Resistance 20 days | 555.89 / 589.31 |
| Data as of | 28 September 2026 20:30 WIB |



