WMT Momentum Gains: Stock Gains 0.69% (September 29, 2026)
On September 29, 2026: price 108.73 USD, trend sideways, RSI 51.7, support 104.87, resistance 110.53. technical analysis of wmt stock. WMT Momentum Gains —…

Walmart is holding a narrow but constructive position on the New York Stock Exchange, with the shares pressing above short-term support while still sitting below a heavier overhead band that has capped recent advances. That matters for international readers because it suggests the stock is not in a breakout phase yet, but it is also no longer drifting in clear weakness.
WMT last traded at 108.73 USD, up from the previous close of 107.98 and ahead 0.69% on the day. Over the past week the gain is 1.20%, and over one month the stock is up 5.47%, which tells the market has been willing to pay more for the shares even though the broader pattern remains sideways. In market terms, that is a sign of accumulation rather than acceleration: buyers are present, but they are not yet forcing a decisive trend change.
Trend & Price Action
The chart shows Walmart trading above its SMA20 at 107.39 but still below its SMA50 at 109.27. That split is important. Being above the shorter average says the latest pullback has been absorbed, while staying under the longer average means the stock has not fully reclaimed medium-term control. There is no fresh MA-cross, so the moving averages are not flashing a new trend signal; instead, they point to a market still searching for direction.
The slope of the SMA20 is 1.08% over 5 days, which supports the idea of a mild upward tilt inside a sideways structure. As shown in the chart, price is also sitting in the upper part of its recent range, at 68% of the 20-hour band. That placement suggests the market is leaning upward, but not yet stretched enough to imply a runaway move.
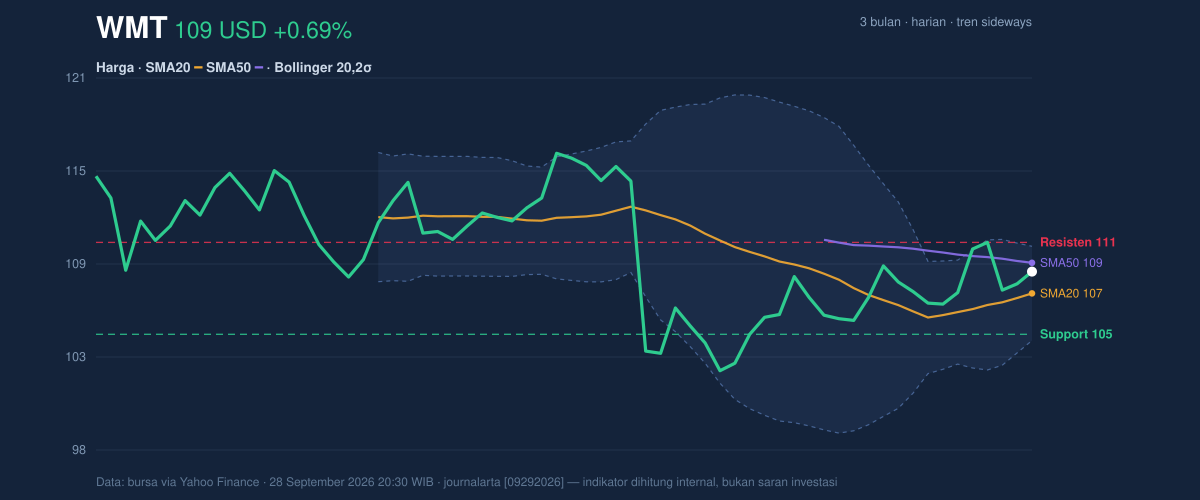
The Bollinger setup adds another layer. The upper band sits at 110.29, the middle band at 107.39, and the lower band at 104.49. With the price near the upper half of the band and %B at 73%, the stock is leaning toward the top of its recent volatility envelope without actually touching it. More importantly, the band width is only 5.4%, described as a squeeze. In plain language, that means price movement has compressed, and compressed markets often precede a sharper move once a side wins control.
Oscillators & Momentum
The momentum picture is more balanced than the price action. RSI at 51.7 is neutral, which means Walmart is neither overbought nor oversold. That matters because it leaves room for further upside if buyers step in, but it also means there is no momentum exhaustion to support an immediate reversal story.
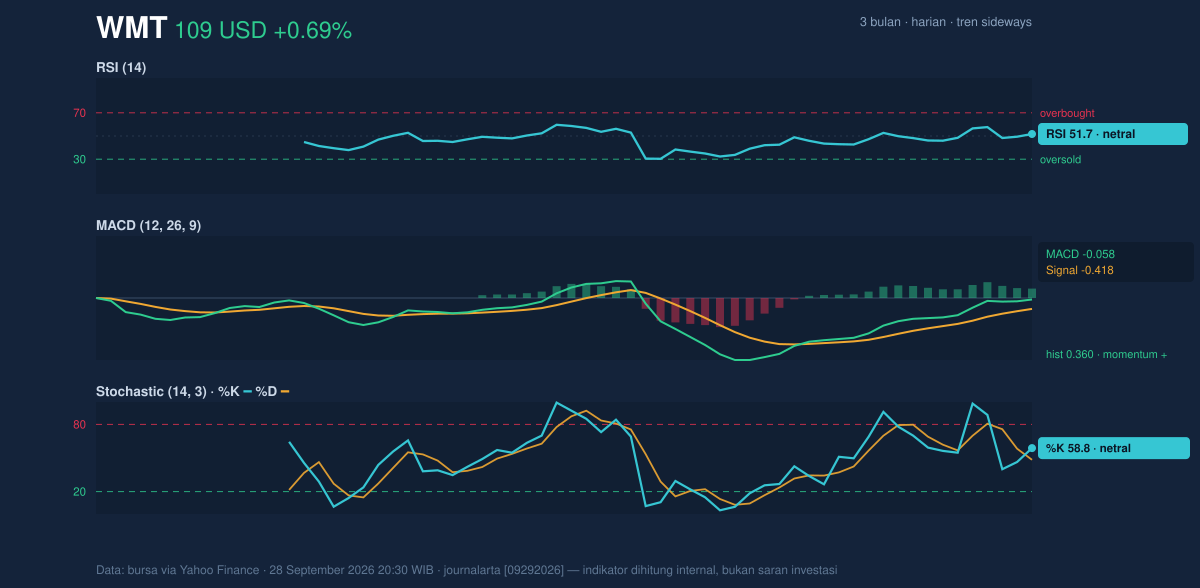
Stochastic is similarly centered, with %K at 58.8 and %D at 48.4. The reading is not extreme, but %K above %D suggests short-term momentum has improved relative to the recent baseline. That is a modest positive sign, not a strong one.
The clearest signal comes from MACD. The line is at -0.058, the signal line at -0.418, and the histogram at 0.360. Even though MACD remains slightly below zero, the positive histogram shows the faster line has moved above the signal line. In practical terms, that is a bullish momentum shift inside a still-neutral trend. It does not confirm a full trend reversal, but it does show that downside pressure has eased.
Volatility & Volume
Volatility is moderate. ATR at 1.87, or 1.7% of price, indicates the stock is moving, but not violently. That fits the Bollinger squeeze: the market is compressed, yet not frozen. Compression plus moderate ATR often means the next directional move can develop quickly once the range gives way.
Volume is less supportive. Last volume was 16,908,100, about 0.7× normal versus the 20-hour average of 22,580,050, and OBV is down. OBV, or on-balance volume, tracks whether volume is flowing into the stock or out of it. A falling OBV while price holds up means the advance is not being backed by broad participation. That is a caution flag: the chart is improving, but the crowd is not fully confirming it yet.
Key Levels & Scenarios
The nearest technical floor is 104.87, while the nearest ceiling is 110.53. With the shares at 108.73, Walmart is trading in the upper part of that corridor, which keeps the market close to a decision point. The 3-month range adds context: the stock has moved between 102.15 and 118.09, so the current level is well above the lower end of the recent quarter but still meaningfully below the peak.
If price can clear the 110.29 Bollinger upper band and then 110.53 resistance, the squeeze would start to resolve upward, and the market would likely test whether the SMA50 at 109.27 can flip from resistance into support. If price fails there, the more likely path is a retreat toward 107.39 and then 104.87 support, where buyers have already shown interest.
Technical Verdict: HOLD (wait & see)
HOLD (wait & see) because the technical picture is improving, but not yet decisive.
- MACD histogram is positive, showing momentum has turned constructive.
- Price is above the SMA20 and near the upper half of the Bollinger band, which supports short-term resilience.
- Volume is only 0.7× normal and OBV is down, so the move lacks strong participation.
Verdict invalidated if price falls below 104.87, the nearest support level.
- Ideal entry range: 107.39 to 104.87
- Exit target: 110.53, with the Bollinger upper band at 110.29 as the first technical hurdle
- Stop loss protection: below 104.49, the lower Bollinger band, or more conservatively under 104.87 support
In plain English: Walmart looks steadier than it did a few sessions ago, but the market has not yet shown enough volume-backed strength to prove the next leg higher.
Summary Data WMT
| Last price | 108.73 USD |
| Change 1 day / 5 days / 1 month | 0.69% / 1.20% / 5.47% |
| Trend / MA-cross | sideways / none |
| SMA20 / SMA50 | 107.39 / 109.27 |
| RSI (14) / Stochastic %K | 51.7 / 58.8 |
| Bollinger %B / ATR | 73% / 1.87 |
| Support / Resistance 20 days | 104.87 / 110.53 |
| Data as of | 28 September 2026 20:30 WIB |


